COVID-19 Data – 3/17/2020

Since my evenings are less occupied with 7th grade math and social studies homework, I have a bit of time to follow my curiosity about COVID-19 data and trends. I plan to update these daily to provide up-to-the-date visualizations. Here are my starting points… (data from Johns Hopkins Whiting School of Engineering — https://github.com/CSSEGISandData)

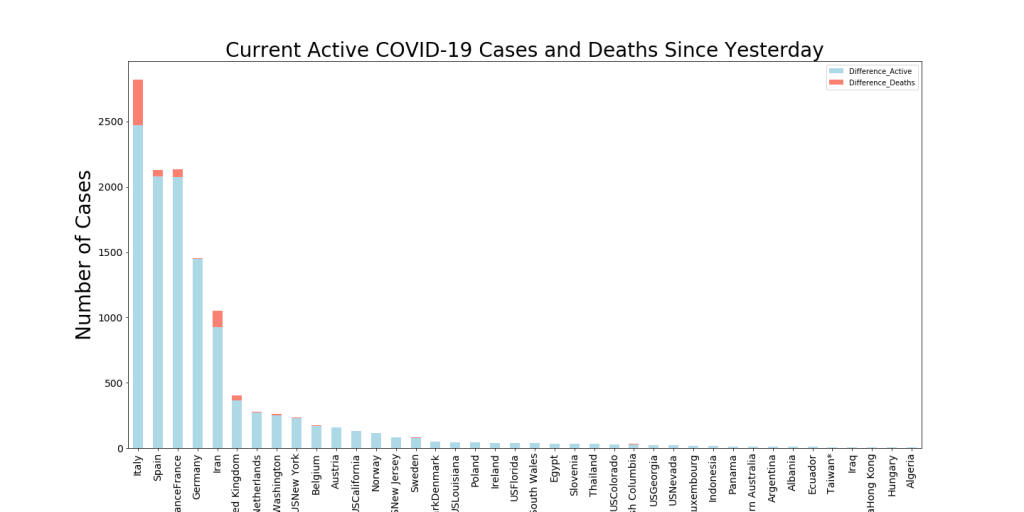
This chart shows a couple of interesting things… first, the current state of Active COVID-19 patients (color per the heat map to the right of the image) and second, the number of Active cases that have been declared in the last 24 hours. This gives an idea of both the velocity and the acceleration of the virus in these regions.

For instance, you can see Europe is overwhelmed by new cases (diameter of the bubbles) but Italy has many more Active cases in its medical pipeline than the other countries.

Below is the current change in Active Cases in the last 24 hours by State. Washington has had the most cases (they’re further along) but New York will probably pass them up tomorrow. New York has the greatest total number of Active cases of any state, with just under 1000.

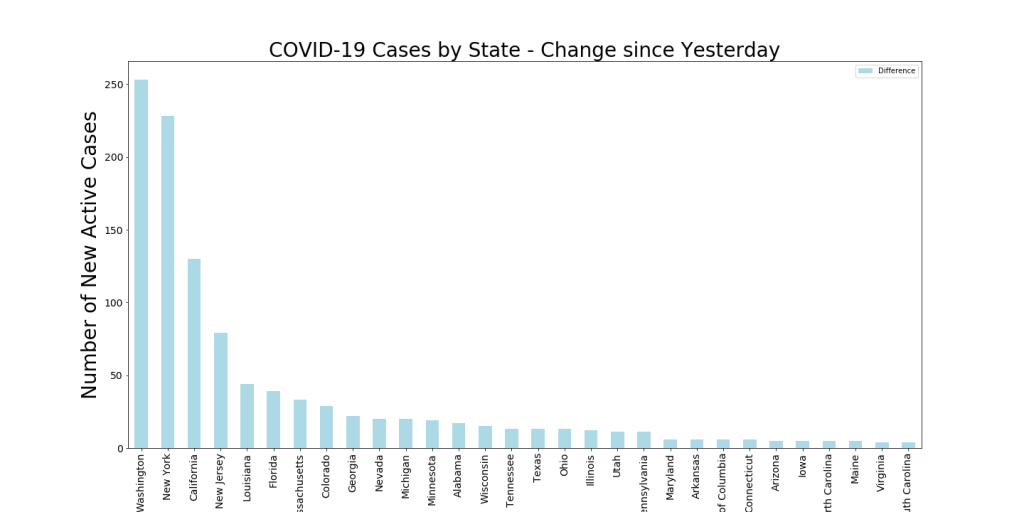
Download a Table of the latest Totals of Active US Cases by State

Stay safe, and let me know if you have any particular analytics in mind that might be useful…

Tucson Monsoon Weather – Rain Prediction Status – 7/30/19

The Rain predictor has continued working well through the monsoon season. Most predictions have been a couple of hours off, though. During the last week it has predicted four rain events correctly (including the start of our 2019 Monsoon season) and has missed one (see table below in red). The Green or Red labels align with the actual time it rained at the house.

Note this is rain at my house, not just rain in the Tucson area. So that makes it a bit more challenging. For instance, on 7/30, one could see heavy rain all around the Tucson area at the times the model predicted, but it didn’t rain at my house until about 3 hrs after the last predicted time.

Tucson Weather – 7/14/19: Monsoons are Here!

Yesterday afternoon at around 4PM (at my house) our first monsoon rainstorm hit with a vengeance! Streets were flooded for a few hours and the temperatures dropped 40 degrees. My rain predictor (see below) predicted this storm 18 hours beforehand, but estimated a time about 2 hrs earlier. This means that the last two times the neural network has predicted rain at my house, it has been right.

See below for latest weekly chart and rain predictions.

Note the humidity spike on the right.
Predicting Rain for Monday early AM and slight probabilities again throughout the day. This model predicts rain 12 hours in the future based on the previous 8 hours of data.

Tucson Weather and Rain Forecast – 7/12/19

Noticed that my rain predictor popped up a strong prediction for about 18 hrs from now. Last time this happened (2 wks ago) it was about 2 hours off on the prediction. Here’s the week’s data plus the prediction chart.

New Feature – Neural Network-based Rain Predictor!

One of my motivators for collecting this data is to figure out how to make predictions using it. I have been running a neural network predictor using this data for a while now with the intent that I could publish rain probability in the future. I have it about ready to show an example. Picking today because the model has made a surprising rain prediction that I don’t understand. (posted on 6/18 at 4PM…)

See graph below to see some of the prediction results. Probability of Rain is predicted for the times referenced.

More on how to design this machine learning workflow.

Tucson Weather – 6/18/2019

Tucson has steadied into its early summer weather pattern. You can see this in the monthly plot below. Lower humidity and (of course!) higher temperatures dominate.

Don’t mind the glitch in the middle, my Raspberry Pi is getting tired and sometimes konks out on me when I go on travel!

Tucson Monsoon Weather – Rain Event – 9/21/2018

Here’s an example of what rain looks like.  We had a good solid day of rain a couple of days ago and you can see it clearly on the chart.  When the green Humidity line intersects the magenta temperature line, that is a really strong indicator of actual precipitation.  Note that the Luminescence plots are much smaller and shorter in the time dimension for the rain day too.  This indicates that the light was low and the day was shorter due to clouds.

Of course, we see the dry trends returning.  Pressure is rising and humidity seems to be falling now.

lightning_sensor_data_plot-week

Tucson Monsoon Weather – Is the Monsoon Returning? – 9/18/2018

In the first chart below you can see the last full month of data.  There was quite a spike in humidity and lightning earlier in the month, but unfortunately it dried up.  The daily humidity oscillation amplitude have decreased and the temperatures have increased slightly since that round of storms.

However… looking at the second chart, which focuses on the last week of data, we can see the humidity numbers increasing.  The sensor has been detecting small lightning events (they may/may not be real, but we have had cloud cover at times).  Are we going to have a return of the monsoon?

lightning_sensor_data_plot-week