Major League Soccer’s Most Compelling Player Development Stories

Where consistent growth meets predictable decline in soccer’s most balanced league


MLS Consistent Top Riser - Playing Time
MLS Consistent Top Risers in Playing time – 2022-24
MLS Consistent Top Decliners - Playing time
MLS Consistent top decliners – 2022-24

While MLS showed remarkable balance in our league-wide analysis, the individual player stories reveal something even more fascinating: Unlike the English Premier League, MLS creates an environment where both breakthrough and decline follow predictable patterns. Here are the standout developmental trajectories from our data. This follows our broad analysis of EPL and MLS playing time minutes… what can this data point measured over time tell us?

The Development Success Stories: MLS at Its Best

Kevin O’Toole: The Textbook Breakthrough

  • Trend: +1,062 minutes per year (R² = 0.995, p = 0.046)
  • Story: From bench player (300 minutes) to full starter (2,400+ minutes). Kevin is 26 and with his first MLS team, NYCFC. He went from 3 appearances in 2022 to 30 in 2024. His consistent increase year-over-year in playing time gives an indicator that one might expect continued development.
  • Why it matters: Nearly perfect R² shows MLS’s ability to nurture consistent development over multiple seasons

Daniel Edelman: The Steady Climber

  • Trend: +765 minutes per year (R² = 0.995, p = 0.046)
  • Story: Methodical progression from 1,000 to 2,500 minutes. Daniel signed his first pro contract with the NYC Red Bulls at age 18. Now at 22 he has signed a “homegrown player” contract with the Red Bulls and has clearly been growing his game consistently. He may still be below the weeds, but the data would suggest that he will continue to improve and get noticed.
  • Why it matters: Represents MLS’s patient approach to player development—no rush, just consistent opportunity growth

Giacomo Vrioni: The Reliable Rise

  • Trend: +992 minutes per year (R² = 0.998, p = 0.025)
  • Story: From role player to key contributor with near-perfect linearity. Giacomo is a Albanian player who was brought into the MLS as a Designated Player. Now with CF Montreal, in his three years with New England he went from 7 appearances to 30 and was the Revolution’s Golden Boot winner last year. He’s 27 now, so he’s probably no longer under the radar, but the playing time stats with New England show that his development is right on track.
  • Why it matters: Shows how MLS systems allow players to gradually earn larger roles

The 900+ Club: Diego Luna (+944), Kerwin Vargas (+910), Calvin Harris (+672)

  • Collective story: Multiple players experiencing similar dramatic upward trajectories
  • Why it matters: Demonstrates MLS’s systematic approach to developing talent—these aren’t isolated success stories. Diego Luna, for instance, started with the USL club El Paso Locomotive and at the time of his transfer, was the highest dollar-value transfer to the MLS in history. His progression from MLS Next Pro to Real Salt Lake has been consistent and he’s now seen as one of the more exciting players in MLS. He scored two goals against Guatemala in the Gold Cup for the USMNT as well.

The Predictable Declines: Even Farewells Follow Patterns

Luis Díaz: The Steepest Fall

  • Trend: -1,443 minutes per year (R² = 1.000, p = 0.003)
  • Story: From starter to complete benchwarmer with mathematical precision. Luis came to the MLS from Costa Rica for about a million dollars and played for the Columbus Crew during their MLS Cup championship season. His decline may have started with an injury sustained on the Costa Rica national team, but it seems like he never was able to find his place on the Crew or any of the other MLS stops he made.
  • Why it matters: Perfect R² shows that even decline in MLS follows predictable patterns rather than chaotic benching

The Veteran Quartet: Marcelo Silva (-1,296), Steve Birnbaum (-1,251), Emanuel Reynoso (-1,243)

  • Collective story: Similar decline rates among established players. Silva is an older player (36) who peaked in 2022 in his thirties (he’s a center back, sometimes they peak late) and declined consistently until he played his way out of the MLS. This is a common trajectory.
  • Why it matters: Suggests MLS has consistent policies for transitioning aging players

Ben Sweat & Pablo Ruiz: The Supporting Cast Transitions

  • Trend: -1,202 and -1,121 minutes per year respectively
  • Story: Role players systematically losing opportunities
  • Why it matters: Even bench players have predictable career arcs in MLS

What Makes MLS Different from Premier League

Higher Statistical Reliability

MLS players show consistently higher R² values (0.995-1.000) compared to Premier League counterparts, indicating:

  • More predictable career trajectories
  • Less rotation-induced chaos
  • Systematic approach to player development and transition

Balanced Opportunity Structure

Unlike the Premier League’s decline-heavy environment:

  • Six rising players with 670+ minute gains per year
  • Six declining players with 1,100+ minute losses per year
  • Perfect balance reflecting the league’s 50/50 trend distribution

Development-Friendly Patterns

  • Rising players: Gradual, sustainable growth over 2-3 seasons
  • Declining players: Orderly transitions rather than sudden benchings
  • Consistency: Fewer injury-related or tactical disruptions

The Age and Stage Factor

Rising Players Profile:

  • Likely younger players earning their first significant opportunities
  • Multi-season development curves rather than sudden breakthroughs
  • System integration taking time but showing results

Declining Players Profile:

  • Veteran players transitioning toward reduced roles
  • Orderly succession planning by MLS teams
  • Respectful role transitions rather than dramatic benchings

The Broader Message

These individual stories confirm our league-wide analysis: MLS has created a development-friendly ecosystem where:

  1. Young players get genuine chances to grow consistently
  2. Veterans experience dignified transitions rather than sudden drops
  3. Career trajectories follow logical patterns that players can plan around
  4. Statistical reliability makes both success and decline predictable

Unlike the Premier League’s “survival of the fittest” chaos, MLS demonstrates that constrained economics can actually create better player development environments.

The Takeaway

While Premier League individual trends were notable for being rare exceptions to chaos, MLS trends represent systematic approaches to player development.

The Kevin O’Tooles and Daniel Edelmans aren’t beating impossible odds—they’re benefiting from a league structure designed to nurture talent growth. Similarly, the declining veterans aren’t victims of random rotation—they’re experiencing planned transitions.

This is what balanced opportunity looks like in practice: predictable development curves that allow players to maximize their potential within a sustainable ecosystem.


These contrasting development stories reveal why league structure matters more than prestige for individual career growth.

Other Entries in the Playing Time Series

The Premier League’s Most Dramatic Career Trajectories

Individual player stories that beat the odds in soccer’s most chaotic league


While our broader analysis (LINK) showed that Premier League careers are notoriously unpredictable, some players have managed to establish clear, statistically significant trends that cut through the chaos. Here are the standout stories from our individual player analysis. Note that these have high R-squared scores and low p-values, meaning their trends are statistically significant… these trends are likely not random chance.

Premier League - Top Risers in Playing Time 2022-24
English Premier League top risers in playing time – 2022-24
Premier League top decliners in Playing time
English Premier League, top Decliners in Playing Time – 2022-24

The Breakthrough Artists: Defying Premier League Odds

Lucas Digne: The Steady Climber

  • Trend: +540 minutes per year (R² = 0.927, p = 0.037)
  • Story: From around 1,200 minutes in 2022 to nearly 2,400 in 2024. All of this increase has come with Aston Villa and has been correlated with Aston Villa’s recent success.
  • Why it matters: In a league where most players decline, Digne has nearly doubled his playing time with remarkable consistency. He left Everton in 2022 due to a disagreement over tactics. It seems that going to Villa was a smart, smart move!

Boubakary Soumaré: The Perfect Trajectory

  • Trend: +534 minutes per year (R² = 1.000, p = 0.005)
  • Story: The most statistically perfect trend in our dataset. Soumaré is another French player who started this trend at Leicester City and continued it on loan to Sevilla. He’s only 26 in 2025, so this trend could indicate future attention from a larger club (since Leicester was relegated this year).
  • Why it matters: His R² of 1.000 means his progression has been flawlessly linear—extraordinary in the Premier League’s chaotic environment

The Dramatic Declines: Premier League’s Harsh Reality

Scott McTominay: The Steepest Fall

  • Trend: -1,184 minutes per year (R² = 1.000, p = 0.013)
  • Story: From a near-2,500 minute starter to complete benchwarmer. Much of McTominay’s decline came from Manchester United signing Casemiro as their defensive midfielder. At the end of 2024 McTominay signed with Napoli, so it should be interesting to see if his minutes increase in Serie A.
  • Why it matters: Shows how quickly fortunes can change… the data gives us insight into a player falling out of favor and being replaced with a stronger signing.

Michail Antonio: The Consistent Decline

  • Trend: -1,067 minutes per year (R² = 0.998, p = 0.026)
  • Story: A textbook example of the aging curve in action. Antonio (35) is the leading goal scorer in the history of the West Ham club. Once he hit age 30, however, his minutes started decreasing. He hardly played at all in 2024 and has now left West Ham and is a free agent.
  • Why it matters: His near-perfect R² shows this isn’t injury-related chaos—it’s a systematic role reduction due to aging.

Fraser Forster: The Goalkeeper’s Dilemma

  • Trend: -540 minutes per year (R² = 0.998, p = 0.031)
  • Story: From regular starter to complete backup. Forster (37) moved from Southampton to Tottenham Hotspur in 2022 and never played much afterwards.
  • Why it matters: Goalkeepers often have the most dramatic role changes—you’re either the #1 or you’re not. Aging can completely flip the switch on a goalie.

What Makes These Trends Special

Statistical Significance in Chaos

All these players have R² values above 0.9, meaning their trends are incredibly reliable despite the Premier League’s notorious unpredictability. This makes them statistical outliers in a league where most changes are random.

The Age Factor

  • Risers (Digne, Soumaré): Players who found their optimal roles or adapted to new systems
  • Decliners (McTominay, Antonio, Forster): Veterans experiencing natural career transitions

Perfect Linearity

Several players show R² values of 0.998-1.000, indicating perfectly linear career progressions. This is remarkable in a league where rotation, injuries, and tactical changes usually create noise.

The Takeaway

While our league-wide analysis showed that Premier League careers are largely unpredictable, these individual cases prove that significant trends can cut through the noise. The key is identifying players with:

  1. High R² values (reliable trends)
  2. Statistical significance (p < 0.05)
  3. Logical explanations (age, role changes, system fit)

In a league where most players face declining opportunities, finding the rare Lucas Dignes and Boubakary Soumarés—players with statistically validated upward trajectories—represents genuine analytical gold.

These individual stories remind us that behind every data point is a human career, and sometimes those careers follow patterns clear enough to predict, even in soccer’s most unpredictable league.


Also see: Experiment High-Level Results and Detailed Analysis of Playing Time Analytics

Next: MLS player spotlights showing how different league structures create different types of breakthrough stories.

Blog Posts in the Playing Time Analytics Series:

Decoding the Data: A Visual Guide to Soccer Player Trends

premier league playing time trends panel

Breaking down the six-panel dashboard that reveals the hidden differences between Premier League and MLS


In our previous analysis, we discovered that MLS offers more stable career opportunities than the Premier League despite being considered a “lower-tier” league. But how exactly did we reach this conclusion? Let’s walk through each visualization in our trend analysis dashboard and highlight what makes these leagues so fundamentally different.

premier league playing time trends panel
Premier League playing time trends (2022-24) panel
MLS Playing Time trends panel
MLS Playing Time Trends (2022-24) Panel

The Six-Panel Story: What Each Chart Reveals

1. Distribution of Minutes Trends (Top Left)

The Foundation: Where Every Player’s Story Begins

This histogram shows how many players are gaining or losing minutes each year across the entire league. Note that these bars describe a CHANGE in playing time over the years of the study.

Premier League: Sharp peak of change in playing time around -130 minutes/year with a mean of -130.8

  • Most players are losing playing time consistently
  • The distribution is skewed left, showing more declining players than improving ones

MLS: Perfectly centered around zero with a mean change in playing time of just -4.0

  • Nearly balanced between players gaining and losing minutes
  • Much more stable environment overall

Key Insight: The Premier League actively pushes most players toward fewer minutes, while MLS maintains equilibrium. We discussed some possible reasons for (and consequences of) this in our previous post.

2. Trend Strength vs Direction (Top Middle)

The Reliability Test: Which Trends Can We Trust?

This scatter plot maps trend direction (x-axis) against statistical reliability (y-axis), with color showing average playing time. We use the metric R-squared to describe how our linear regression line “fits” the actual data. A R-squared of 1 means the regression line perfectly describes the data.

Premier League: Scattered, chaotic pattern with few high R-squared values

  • Most trends are statistically unreliable (low R-squared)
  • Even dramatic changes might just be random variation

MLS: More structured patterns with slightly higher R-squared clustering

  • Trends are somewhat more predictable and reliable
  • When changes happen, they’re more likely to be “real”

Key Insight: MLS player trajectories are more predictable, while Premier League careers are subject to more randomness. Check our previous post for fuller analysis of why this might be happening and what it might mean.

3. Playing Time vs Trend Direction (Top Right)

The Democracy Test: Do Stars Get Special Treatment?

This scatter plot reveals whether high-minute players (established stars) have different trend patterns than bench players.

Both Leagues: Remarkably similar scatter patterns between MLS and EPL.

  • No clear correlation between current playing time and future trends
  • Even established starters can see declining or increasing minutes
  • We do see much less variability in the “slope” of the change of playing time over 3 years for the least-used and most-used (stars) players.

Key Insight: Both leagues show “democratic” opportunity distribution—your current status doesn’t guarantee your future trajectory, but the more minutes you play, after a point, the less likely you’ll see a large change in your playing time.

4. Distribution of Trend Directions (Bottom Left)

The Balance Sheet: Winners vs Losers

Simple pie charts showing the percentage of players with increasing vs decreasing minutes.

Premier League: 59.5% Decreasing vs 40.5% Increasing

  • Clear bias toward player decline
  • “Survival of the fittest” mentality

MLS: 50.5% Decreasing vs 49.5% Increasing

  • Almost perfect balance
  • More “rising tide lifts all boats” approach

Key Insight: This single chart captures the fundamental philosophical difference between the leagues.

5. Statistical Significance (Bottom Middle)

The Reality Check: How Much Is Just Noise?

Bar charts showing how many trends are statistically significant versus random variation.

Premier League: ~95% non-significant trends

  • Most changes are just rotation chaos and random variation
  • Very few predictable career patterns

MLS: ~90% non-significant trends

  • Still mostly unpredictable, but slightly more reliable patterns
  • Some genuine career trajectories emerge from the noise

Key Insight: Both leagues have unpredictable elements, but Premier League chaos makes career planning nearly impossible.

6. Slope Distribution by Significance (Bottom Right)

The Magnitude Question: Are Real Trends Bigger Than Random Ones?

Box plots comparing the size of statistically significant trends versus random variation.

Premier League: Similar box sizes between significant and non-significant

  • Even “real” trends aren’t much larger than random fluctuations
  • Extreme outliers in both categories

MLS: Slightly wider “significant” box

  • When trends are real, they tend to be more substantial
  • Less extreme random variation

Key Insight: MLS rewards patience—real trends are more distinguishable from noise.

The Visual Story: What It All Means

Premier League = High-Stakes Casino

The charts paint a picture of a league where:

  • Most players are on declining trajectories. New, skilled players are always arriving.
  • Randomness dominates over predictable patterns
  • Career planning is nearly impossible
  • High rotation and pressure from younger players coming from all over the world create constant uncertainty

MLS = Balanced Ecosystem

The visualizations reveal a league where:

  • Players have genuine development opportunities. Pressure from skilled, new arrivals is much lower.
  • Trends are somewhat more reliable and predictable
  • Career trajectories can be planned and managed
  • Stability allows for longer-term thinking

Reading Between the Lines

The Economics Show Up in Every Chart

You can see the Premier League’s financial pressure in every visualization:

  • The negative trend distribution (constant upgrades)
  • The chaotic scatter patterns (rotation due to multiple competitions)
  • The low significance rates (panic-driven decisions)

MLS’s Constraints Create Opportunity

The salary cap and roster rules manifest as:

  • Balanced opportunity distribution
  • More reliable trend patterns
  • Genuine player development curves

Practical Applications

For Players: Use these charts to understand which league environment suits your career stage and goals.

For Analysts: The significance rates tell you which trends to trust for predictions.

For Fans: These patterns explain why your favorite player’s role might be more stable in MLS than you’d expect.

The Bottom Line

Six simple charts reveal a profound truth: league structure fundamentally shapes individual careers. The Premier League’s unlimited resources create chaos, while MLS’s constraints foster stability.

Sometimes the most important insights come not from complex algorithms, but from carefully visualizing the simple question: “Are players generally getting more or fewer opportunities over time?”

The answer, as these charts clearly show, depends entirely on which side of the Atlantic you’re playing.


Next up: Individual player spotlights showing which specific players are beating the odds in each league’s unique environment.

Blog Posts in the Playing Time Analytics Series:

The Tale of Two Leagues: What Player Minutes Data Reveals About Premier League vs MLS

premier league playing time trends panel

A deep dive into how league structure and economics shape player career trajectories


When we think about the differences between the English Premier League and Major League Soccer, we usually focus on the obvious: prestige, talent level, global reach. But what if I told you that the most revealing differences lie hidden in something as simple as playing time trends?

Using advanced statistical analysis of player minutes over multiple seasons, I uncovered some interesting patterns that hint at the fundamental DNA of these two leagues. The results are more fascinating—and counterintuitive—than you might expect.

The Numbers Don’t Lie: A Study in Contrasts

After analyzing thousands of players across both leagues from 2022-2024, the data tells a clear story:

Premier League: The Decline Machine

  • Average player loses 131 minutes per year
  • 60% of players see decreasing playing time
  • Highly unpredictable rotation patterns
  • Indication: “Win-now” mentality dominates

MLS: The Stability Engine

  • Average player loses only 4 minutes per year (essentially flat)
  • Perfect 50/50 split between rising and declining players
  • More predictable career trajectories
  • Indication: Development-focused approach

The Opportunity Paradox: Why Less Money Means More Chances

Here’s the counterintuitive finding: MLS, despite being a “lower-tier” league, actually offers more stable career opportunities than the world’s most prestigious soccer competition.

The Premier League’s Brutal Economics

In the Premier League, money and prestige creates chaos. With transfer budgets exceeding $200 million and relegation costs around the same figure, clubs operate in constant panic mode (Man U, looking at you). The result? A “disposable player” mentality where:

  • Aging curves hit like a cliff – one bad season and you’re replaced.
  • Heavy rotation due to multiple competitions (Premier League, cups, Champions League)
  • Global talent influx means constant competition from new signings. There are players in lesser leagues all around the world eyeing your spot!
  • Managerial pressure leads to frequent tactical changes and lineup shuffles. Average tenure of an EPL manager is down to somewhere around 800 days!

All of these disruptive factors can be observed in the playing time trends across seasons

MLS’s Forced Patience

MLS’s salary cap ($5 million per team) and unique roster rules create an entirely different dynamic. Yes, there are negatives, but there are also some positives regarding player development:

  • Limited upgrading ability forces teams to develop existing talent
  • No relegation reduces panic-driven decisions and relegation-based “unloading” of players
  • Designated Player rule (only 3 “superstar” signings) emphasizes squad depth
  • Draft system creates investment in domestic player development

What This Means for Players

Premier League: High Risk, High Reward

If you can survive the craziness of Premier League rotation and competition, you’re likely exceptional. But the data shows most players experience declining opportunities over time. It’s a league that chews up talent and spits it out. Even the best players can struggle to find a fit on a high-performing EPL team.

MLS: The Developer’s Paradise

MLS offers something increasingly rare in modern soccer: time to develop. Players get longer leashes, more consistent opportunities, and genuine chances for comeback stories. MLS Next Pro is now standing up as a developmental league and the USL Academy is also ramping up development of players who might be expected to play in the USL or MLS.

The Bigger Picture: League Structure Shapes Destinies

This analysis reveals a profound truth about modern soccer: financial inequality doesn’t just affect competitive balance—it fundamentally alters how players’ careers unfold.

Some Quick Thoughts on Lessons for Different Stakeholders:

Young Players: Might be best off to consider MLS for development opportunities, even if it means lower initial prestige

Fantasy Soccer Players: Premier League minutes are nearly impossible to predict; MLS offers more reliable patterns. Perhaps this is meaningful or not, but playing fantasy at a high level means understanding what about the sport is predictable and what is not.

Talent Evaluators: Players succeeding in Premier League’s chaos demonstrate exceptional adaptability. EPL teams in general are using these kinds of analytics to evaluate upcoming players who have survived the meat grinder.

League Administrators: Salary caps and roster rules can actually improve player development environments. Not sure if the MLS cares about this as much as the rules’ influence on the bottom line, but I find it interesting.

The Statistical Deep Dive

The trend analysis used linear regression to track each player’s minutes change over time, revealing:

  • Statistical significance: MLS trends are more reliable and predictable
  • Extreme outliers: Both leagues have dramatic success/failure stories, but Premier League outliers are more likely to be noise
  • Career stability: MLS players can better predict their role evolution

Looking Forward: Implications for Global Soccer

As soccer becomes increasingly globalized and commercialized, these findings suggest we might need to reconsider our assumptions about league quality and player development.

The Premier League model—unlimited spending, constant roster turnover, high-pressure environment—may be great for spectacle but potentially problematic for sustainable player development.

The MLS model—constrained spending, forced player development, balanced opportunities—might offer lessons for other leagues seeking to optimize talent cultivation.

Conclusion: It’s Not Just About the Money

While the Premier League will always attract the world’s best talent through prestige and wages, this analysis shows that more money doesn’t automatically mean better opportunities for most players.

MLS, with its salary caps and development focus, has accidentally created something valuable: a league structure that gives players genuine chances to grow, adapt, and succeed over time.

In an era of increasing player burnout and shortened careers, perhaps there’s wisdom in the MLS approach. Sometimes, constraints breed opportunity.


This analysis was conducted using data from FBRef.com, followed by statistical trend analysis across multiple seasons.

Want to dive deeper? The complete dataset and visualizations reveal even more fascinating patterns about age, position, and team-specific trends that continue to challenge conventional wisdom about player development in modern soccer.

Playing Time Trend Analysis Charts for EPL from 2022-24
Playing Time Trend Analysis Charts for MLS from 2022-24

Blog Posts in the Playing Time Analytics Series:

The Premier League 2024-25 Season: When Data Meets Reality

2024-25 EPL xG / Luck Charts

The final table is now complete, and while Liverpool ran away with their second Premier League title in the modern era, the most fascinating story might be how dramatically some teams over- and under-performed their underlying metrics.

Nottingham Forest: The Great xG Overperformance

The expected points ratio has Nottingham Forest as finishing 13th, six places and 14.6 points worse off than their actual final standing. As I suspected early in the season, Forest’s remarkable 7th-place finish—securing European qualification (UEFA Euro Conference League) for the first time in decades—was built on consistently outperforming their expected goals (xG), a measure that I call “luck.”

What made Forest’s run so remarkable wasn’t just the scale of their over-performance, but its consistency. Forest’s style of play often invites pressure and opposition chances but that is by design. Unlike other teams that might show positive “luck” at home but negative away (or vice versa), Forest maintained their xG over-performance across all environments throughout most of the season.

However, as regression tends to demand, the magic eventually faded. Forest’s late-season stumble saw them narrowly miss Champions League qualification, though they still secured a European spot that seemed impossible just a few years ago.

The Salary Predictor Holds True (Mostly)

The old Premier League adage that payroll predicts performance largely held this season. Liverpool have won their crown — a second in the Premier League era and record-equaling 20th in English top-flight history, while Arsenal have pretty much second place and will return to the UEFA Champions League, where they are joined by Manchester City, Chelsea, Newcastle United, and Europa League winners Tottenham Hotspur.

The blue-bloods with the highest wage bills ultimately rose to claim the top spots. Manchester United, continuing their recent trend, managed to finish disappointingly low despite their substantial payroll—a perfect example of how money doesn’t guarantee efficiency.

The Magnificent Mid-Table Marvels

The most intriguing stories emerge from the middle of the table, where several clubs punched well above their financial weight. The “three Bs and two Fs”—Bournemouth, Brentford, Brighton & Hove Albion, Fulham, and Forest—all achieved impressive campaigns despite relatively modest wage bills.

Bournemouth can perhaps feel the most aggrieved. Despite finishing ninth in the table, the underlying data suggests their performances were strong enough for a sixth-place finish, a position that would have secured Europa League football. This represents smart recruitment and tactical sophistication overcoming financial limitations.

What unites these overachieving clubs? None showed significant home advantage in their xG metrics, suggesting their success came from systematic tactical approaches rather than fortress-like home environments. Notably, three of these five teams demonstrated positive “luck” in away fixtures, indicating strong mentality and game management on the road.

Newcastle’s Home Fortress Phenomenon

Rankings of EPL stadiums by “Luck” at home. 2024-25 season.

The most striking individual stadium story belonged to Newcastle United. St. James’ Park emerged as the “luckiest” venue in the Premier League this season (see above), with Newcastle dramatically over-performing their xG at home while suffering equally dramatic under-performance away.

This stark home-away split suggests something unique about the Newcastle home environment—whether tactical, psychological, or atmospheric—that consistently pushed results beyond what the underlying numbers suggested they deserved. Paradoxically, this imbalance may have limited their potential; a more even distribution of their “luck” could have yielded even better results.

Crystal Palace: The Selhurst Park Puzzle

At the opposite extreme, Crystal Palace endured remarkably poor fortune at their home ground. Selhurst Park ranked as one of the unluckiest venues in the league, with Palace consistently underperforming their home xG despite their famously passionate support.

The prevailing theory suggests that the exceptional home atmosphere might paradoxically work against Palace, with players becoming overconfident or casual in front of their devoted fans. While this explanation remains speculative, the data clearly shows a venue where good chances consistently went begging. See this link from the Athletic (paywall, of course) where they discuss this very thing.

Crystal Palace (finished 12th) should have also been able to talk about a top-half finish, according to their xG data.

The Bottom Line

The 2024-25 season reinforced that while underlying metrics provide valuable insights into team performance, football’s beautiful unpredictability ensures that “luck”—positive and negative—remains a crucial factor. Forest’s European qualification, Bournemouth’s overachievement, and Newcastle’s home-field advantage all tell stories that pure statistics cannot fully capture.

As we head into the summer transfer window, the clubs that can maintain their positive variance while addressing their underlying weaknesses may find themselves best positioned for 2025-26 success.

What patterns did you notice this season? Share your thoughts in the comments below.

If you want to be added to our newsletter (no worries, we won’t overwhelm you), we often create bonus material only for newsletter subscribers. Just sign up with your email address below.

Following the Money: EPL vs. MLS Salary Distribution Analysis

EPL 2024-25 Salary Distributions by Team

The Premier League Salary Secret

It’s no secret that team salary is one of the strongest predictors of Premier League championships. I regularly highlight this correlation in my xG (expected goals) charts. But what happens when we look beyond total team spending to examine how those salaries are distributed among players?

Are Premier League teams spreading their wealth evenly across the squad, or are they concentrating resources on a few superstars? Let’s dive into the data.

Salary Histogram – Player Salaries for each EPL team (converted into US Dollars)

The Elite Salary Tier: Where Champions Are Made

Looking at the thin red lines I’ve circled on the charts, we can see clear salary outliers. Few players in the EPL earn more than $12M annually, and these elite earners are concentrated among the league’s powerhouses:

  • Manchester City
  • Manchester United
  • Liverpool
  • Arsenal

Each of these clubs maintains multiple players in this elite salary bracket.

The Budget-Conscious Clubs

In contrast, several clubs operate with dramatically different salary structures:

  • Ipswich Town: Most players earn under $2.5M, with just two outliers at $5M and $8M
  • Bournemouth: Rarely exceeds the $5M threshold
  • Brentford: Similar conservative salary structure
  • Wolverhampton: Features a left-heavy distribution that tapers linearly toward $5M
  • Southampton: Few players above the $5M mark

These distinct distribution patterns reflect each club’s business strategy and financial resources.

MLS: A Different Financial Universe

MLS Player Salary Histograms – Current 2025 season

The contrast between EPL and MLS salary structures is striking.

In MLS:

  • Only one player earns over $10M (Lionel Messi at Inter Miami)
  • Teams show distinct strategies:
    • Seattle Sounders and Real Salt Lake: Heavy concentration of players at league minimum ($71K)
    • Vancouver, Sporting KC, New England Revolution, San Jose: More evenly distributed salaries
    • Inter Miami and NY Red Bulls: 15 players at league minimum with just a few high earners

Miami’s Star Strategy

Inter Miami concentrates its resources on three global stars:

  • Luis Suárez
  • Lionel Messi
  • Sergio Busquets

The Big Picture: Money and Competitive Strategy

This salary analysis reveals fascinating differences in team-building approaches:

  • Elite EPL clubs: Often backed by sovereign wealth funds or billionaire owners, these teams can afford multiple top-tier salaries
  • Mid-tier EPL clubs: Teams like Bournemouth, Brentford, and Brighton focus on talent development and advanced scouting to remain competitive
  • Underperforming big spenders: Some teams (looking at you, Spurs and Man United) aren’t maximizing their return on substantial salary investments
  • MLS clubs: Operating in a different financial ecosystem entirely, with only Miami able to compete with even mid-tier EPL clubs in terms of star power

What’s your take on these different financial strategies? Which approach do you think creates the most sustainable success? Let us know your thoughts in the comments below!

If you want to be added to our newsletter (no worries, we won’t overwhelm you), we often create bonus material only for newsletter subscribers. Just sign up with your email address below.

English Premier League with Two Match days to Go!

Trends in the EPL are very intriguing as the season comes to a close. We’ve seen Liverpool and Arsenal dominate throughout the year, but now there are some clubs peaking and charging up the table. Let’s look at our standard xG/Luck charts and see what’s there.

Current EPL xG plot (5/6/25). Ordered by points.

Below is the chart from January 2025 for comparison.

EPL xG chart from January 2025.

Premier League European Race: What Trends do We See between January and May?

Nottingham Forest: Sliding Down the Table

  1. Nottingham Forest’s European dreams appear to be fading as their xG (expected goals) ratio has declined significantly from 1.15 in January to approximately 0.85 now. This substantial drop coincides with their fall from third to sixth in the table.
  2. While they continue to overperform their expected goals both at home and away (positive “Luck” metrics), the underlying expectations have decreased. Unless they can reverse this xG trend quickly, European football likely remains out of reach.

Chelsea: The Dark Horse Rising

  1. Chelsea’s strong underlying metrics are finally translating to results. Their consistently high xG ratio suggested better performances were coming, and now with improved home “Luck” metrics, they’re climbing the table. Their recent victory over Liverpool demonstrates they’re serious contenders for European qualification.

Bournemouth: Excellence Without Reward

  1. Despite maintaining an impressive xG ratio throughout the season, Bournemouth has slipped behind Aston Villa in the standings. Villa’s strategic additions (including Marcus Rashford) and Champions League experience may have given them the edge, likely leaving Bournemouth just short of European competition despite their excellent campaign.

Manchester City: Champions’ Resilience

  1. Even without star striker Erling Haaland, Manchester City has shown remarkable resilience. After dropping points earlier, they’ve steadily climbed back up the table. With a favorable remaining schedule against weaker opposition, their Champions League qualification looks increasingly secure.

Europa Cup Twist

  1. The upcoming Tottenham Hotspur vs. Manchester United Europa Cup final adds another layer of intrigue to the qualification race. The winner will secure an automatic Champions League berth, potentially affecting qualification opportunities for teams between them and the top six.

If you want to be added to our newsletter (no worries, we won’t overwhelm you), we often create bonus material only for newsletter subscribers. Just sign up with your email address below.

2024-25 Premier League Current Status

The season has less than 20 matches remaining, so I figured it might be a good time to evaluate where the clubs stand regarding the xG ratio, luck, and salary. Refer to past analyses in my soccer analytics category to see previous years.

What I’m curious about is if these measures reveal the likelihood of relegation, for, say, Manchester United or Tottenham. Both of these big, wealthier clubs are having really horrible years. Lets see what the data tells us.

2024-25 Season Current Results

Analysis of the Top of the Standings

One thing that stands out is how Liverpool and Arsenal have by far the highest xG ratios. That means, based on the shots they’re taking and allowing, their play is extremely favorable for wins. Both of these clubs are at the top of the table, so there’s a chance that this ratio is (unsurprisingly) quite correlated with points in the standings. Frequently we see that salary (the blue bars) are the most correlated element to points, but this year we see Man City, Man U, and Chelsea all struggling down the standings but with very high salaries. Nottingham Forest feels like they’re punching way over their weight with one of the lowest salaries in the entire Premier League, though. I notice that their xG ratio is a bit lower than the 3-4 clubs behind them in the standings and their away and home luck factors are both greater than zero. It is interesting to notice that though Nottingham finished quite low in the Premier League standings last year, they happened to have the worst away luck factor in the league. A few breaks going their way in 24-25 and now we see them in contention for a Champion’s League slot!Stay tuned, however, to see if they will settle a few spots lower in the standings based off of their current year’s above average luck factor. Additionally, it would seem that Chelsea could move up if they improve their home luck factor because their xG ratio is third highest in the league.

Analysis of the Bottom of the Standings

Our three teams in relegation positions right now (and also the Wolves and Everton) all seem to deserve their placement. Having an xG ratio below zero indicates that their opponents are getting better opportunities for scores than their own offense. This is obviously a recipe for a lot of losses. I kind of expected Ipswitch Town to struggle this year and get relegated, but their position in the third slot is possibly because their luck factor away (their overperformance of their expected goals) is the highest in the league. This is probably not likely to continue, so if I was an Ipswitch supporter, I wouldn’t have very high expectations for their last 17 games.

If you want to be added to our newsletter (no worries, we won’t overwhelm you), we often create bonus material only for newsletter subscribers. Just click the box below.

Update: xG and Luck Update for Premier League

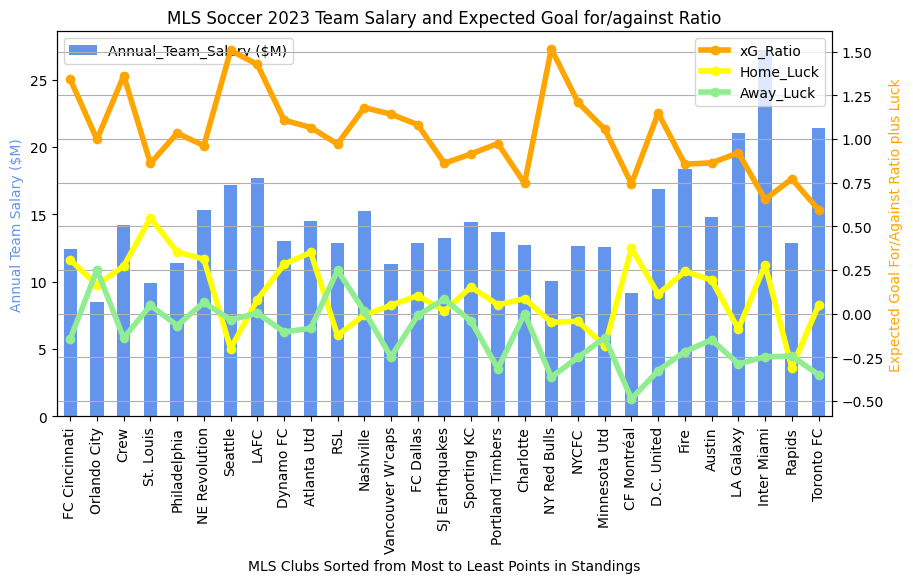
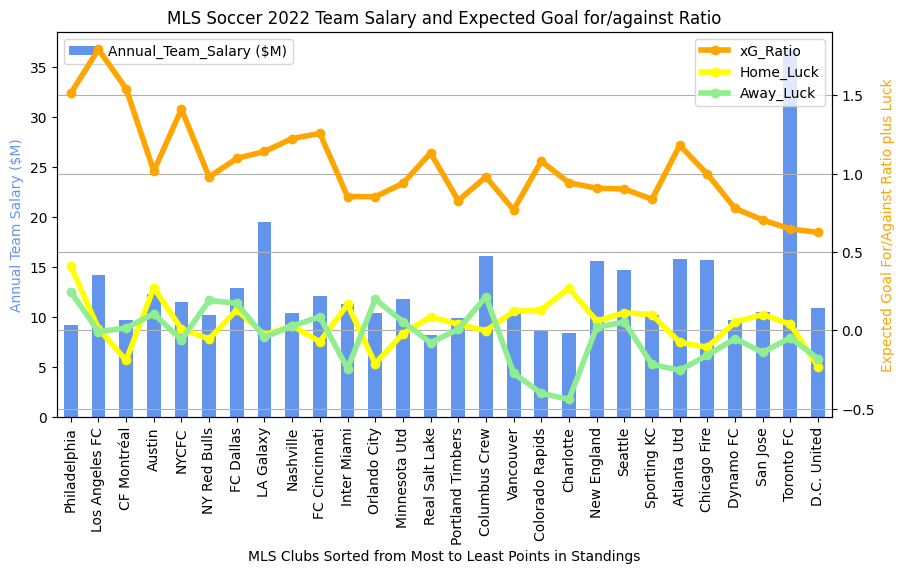
In the previous entry, I compared the expected goals / Luck metrics between the last two completed MLS seasons. Now that the Premier League season has come to a close, we can do the same thing to see if any new patterns jump out at us.

2023-2024 Premier League final results

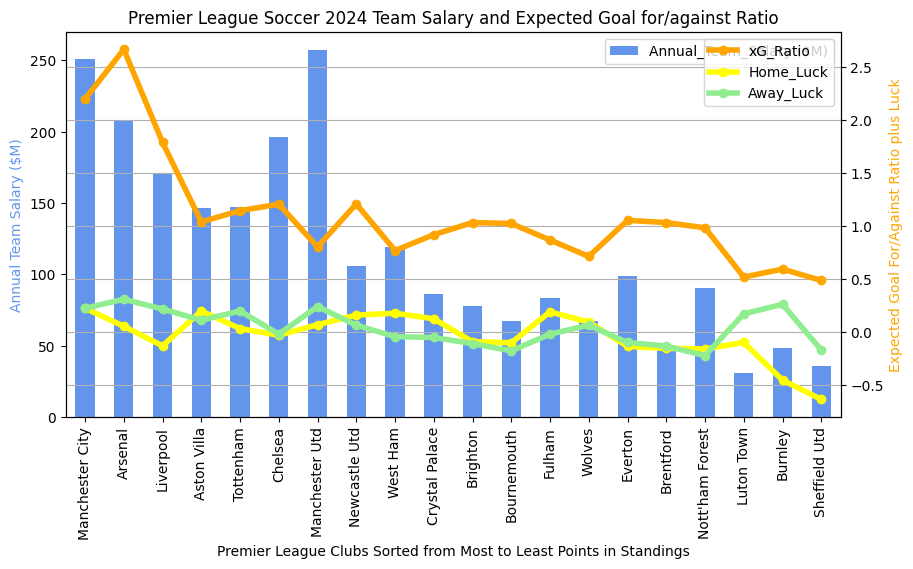
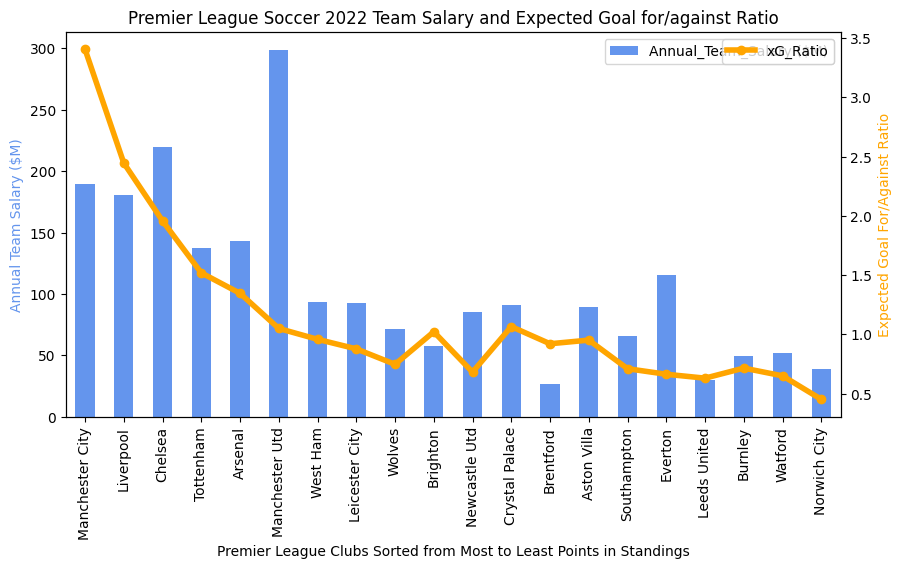
A quick overview of what we see above would go something like this… Manchester City finished at the top of the league in points, followed by Arsenal. The teams are sorted by final point tally from left to right on the chart. The three teams to get relegated are on the far right (Luton Town, Burnley, and Sheffield United). Things I see:

  1. Man City and Man U always have the highest salaries. Lately Man U has been inconsistent in play and has been finishing out of the top four. Their expected goals for/against ratio is a bit lower then their direct neighbors in points (Chelsea and Newcastle). We don’t know exactly why, but it reflects their overall efficiency at taking and preventing good shots. For some reason, Chelsea and Newcastle were a bit more efficient at ensuring that they got more good shots than their competitors in matches. Interestingly, we see West Ham sitting at about 1/2 Man U’s salary but with nearly the same xG ratio. But West Ham finished 8 points lower than Man U. Perhaps there are ways that expensive players help other than in the xG ratio. I might imagine that expensive, ostensibly better players may be slightly more likely to score when taking a good shot or to prevent an opponents good shot from going into the net.
  2. Salary in the Premier League seems to always be more important than in MLS. The top salaries are always in the top 1/2 of the league in points in the Premier League, but this is not as strongly observed in MLS.
  3. Luck. Sometimes there’s an interesting disparity between luck at home and luck on the road (the yellow and green lines respectively). Near the top of the rankings, we see that Liverpool’s home luck is below zero (meaning that they score less goals on average than their expected goals would predict) but their away luck is above zero. I did a quick google on Liverpool and “home luck” and found this. So others have noticed this, but I don’t see that they have observed that most of Liverpool’s luck has been in away venues. On the bad side of the rankings, though, we see large differences open up between home and away luck. All three relegated teams really struggled on the road to score up to their expected goals (i.e., good shots weren’t going in). Clearly this is an important measurement for identifying that your team is in big trouble. Conversely, though, if your team finishes positive on both home and away luck, it seems that this can offset a big salary differential (see Arsenal, Aston Villa, Tottenham, and Newcastle, all in the top half of the league in points).

2022-2023 Results for Comparison
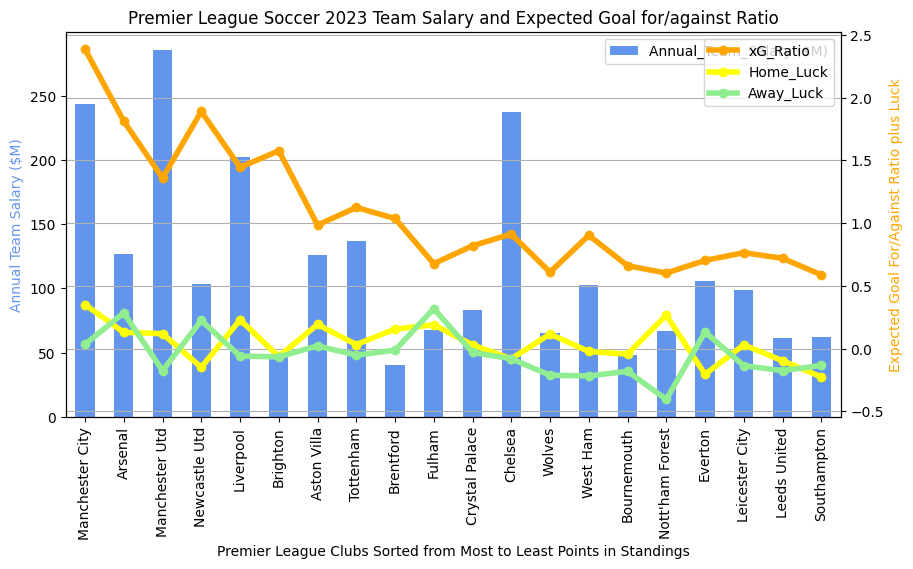
2022-2023 Premier League final Results

Stuff to discuss:

  1. Chelsea was a strange outlier during this season regarding salary and final point tally. Their xG ratio is below 1 and both their home and away luck are negative. Efficiency seems to have been an issue. Compare to Fulham who finished 8 points ahead of them with somewhere around 1/4 of the salary. Fulham had lower xG than Chelsea this season but had great luck both home and away. Note that Chelsea finished higher in 2023-24 and Fulham finished much lower as their luck regressed back to the mean.
  2. There’s also a big delta between Nottingham Forest’s home and away luck during this season. They finished just ahead of relegation, but maybe they did so just by the skin of their teeth due to their abysmal away luck (lowest in the league). Note that in 2023-24, Nottingham again skated just ahead of relegation, but both their home and away luck were just below zero. Speaks perhaps to inconsistency in scoring off of good chances, probably a predictor of a future relegation.
  3. We again see a number of teams in the top half where positive away and home luck offsets a salary gap. Note Arsenal, Aston Villa, Brentford, and Fulham all in the top half.

LINKS to Other Soccer Analytics Entries

  1. Soccer Analytics Series Intro
  2. MLS and Premier League Comparison
  3. Home and Away Luck Metric
  4. Does Counterpressing Work? Evidence.
  5. Evaluation of Outcomes using the Luck Metric
  6. More Analysis using the Luck Metric
  7. Soccer Analytics in Practice – Youth Soccer Example
  8. xG and Luck update on recent MLS season
  9. xG and Luck update on recent Premier League season

Update: MLS Latest xG ratio and Luck stats

I haven’t updated the charts in previous entries for the end of the 2023 MLS Season and the 2023-24 Premier League season. I re-ran my stats and here goes, MLS first.

2023 Final MLS season Stats – xG and Luck

Now to make a better comparison, here’s the results for the end of the 2022 season.

2022 Final MLS season Stats – xG and Luck

I like these metrics (xG ratio and Home/Away Luck) because they paint a pretty good picture of an awful lot that happens in a soccer match. As a reminder, xG stands for “expected goals” and the ratio is xG for the team being measured divided by xG of their opponent during the match. Expected Goals are calculated statistically based off of where a shot on goal is taken. Closer and more centered shots have a much higher likelihood of scoring, and therefore count as 0.5 or higher expected goals. The ratio, therefore, gives a pretty good idea of whether a team was getting in position to take good shots and whether they were limiting their opponents to less good shots.

Luck is the comparison of the number of goals scored to the xG. If Austin FC scores 3 goals, therefore, but their xG is only 1.8, then they have a luck of positive 1.2. As you can see, it is quite possible to have a luck of less than zero too (meaning you were just unlucky. You were in position and took good shots, they just didn’t go in). The trend does seem stronger in 2022, though, than it does 2023.

Interesting Trends

  1. I don’t see any Luck trends from 2022 to 2023. This is unsurprising due to the statistical nature of luck, but one always hopes to find a pattern where some team is “making” their own luck.
  2. Since the teams are sorted by number of points (highest on the left), it is not surprising that the xG ratio trends pretty decently with the season points. We would expect teams that win more and therefore get more points for the season to also have better shots overall than they allow to their opponents. in 2023 we do have a few notable outliers (NYRB and Seattle) who had a really strong xG ratio but finished lower in points.
  3. MLS also shows an interesting trend where teams with high salaries (the blue bar) don’t always finish in the upper 1/4 of the league. In 2023, there are quite a lot of high salary teams in the lower 1/4, actually. This is very unlike what we’ll see in the next entry where we review the English Premier league results. Hard to put one’s finger on this completely, unless it has something to do with older European stars coming to MLS at the ends of their careers?

LINKS to Other Soccer Analytics Entries

  1. Soccer Analytics Series Intro
  2. MLS and Premier League Comparison
  3. Home and Away Luck Metric
  4. Does Counterpressing Work? Evidence.
  5. Evaluation of Outcomes using the Luck Metric
  6. More Analysis using the Luck Metric
  7. Soccer Analytics in Practice – Youth Soccer Example
  8. xG and Luck update on recent MLS season
  9. xG and Luck update on recent Premier League season