

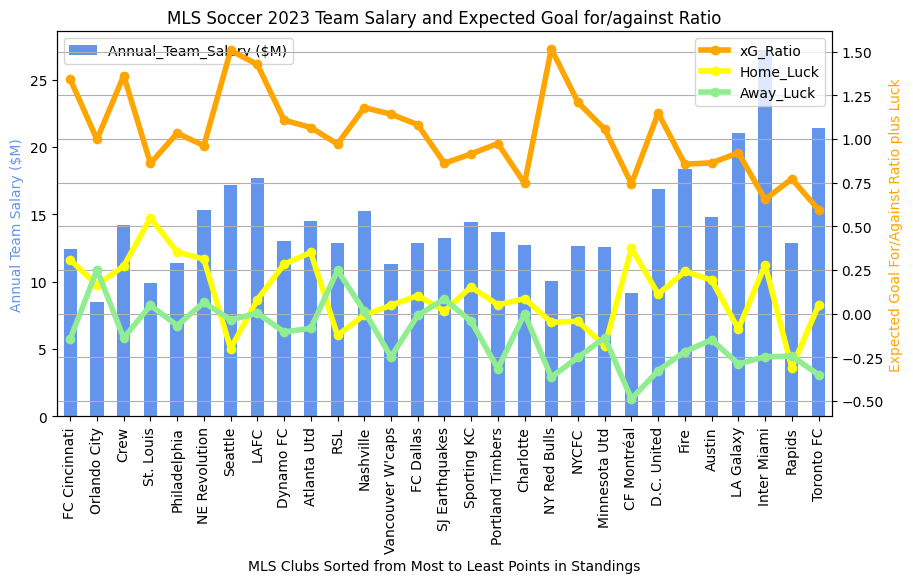
I haven’t updated the charts in previous entries for the end of the 2023 MLS Season and the 2023-24 Premier League season. I re-ran my stats and here goes, MLS first.
Now to make a better comparison, here’s the results for the end of the 2022 season.
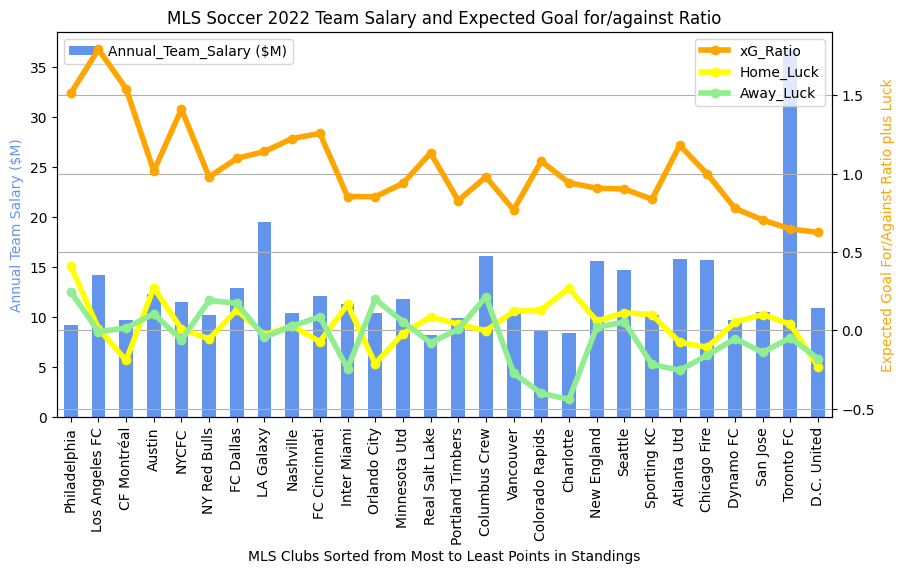
I like these metrics (xG ratio and Home/Away Luck) because they paint a pretty good picture of an awful lot that happens in a soccer match. As a reminder, xG stands for “expected goals” and the ratio is xG for the team being measured divided by xG of their opponent during the match. Expected Goals are calculated statistically based off of where a shot on goal is taken. Closer and more centered shots have a much higher likelihood of scoring, and therefore count as 0.5 or higher expected goals. The ratio, therefore, gives a pretty good idea of whether a team was getting in position to take good shots and whether they were limiting their opponents to less good shots. Luck is the comparison of the number of goals scored to the xG. If Austin FC scores 3 goals, therefore, but their xG is only 1.8, then they have a luck of positive 1.2. As you can see, it is quite possible to have a luck of less than zero too (meaning you were just unlucky. You were in position and took good shots, they just didn’t go in). The trend does seem stronger in 2022, though, than it does 2023.
Interesting Trends
- I don’t see any Luck trends from 2022 to 2023. This is unsurprising due to the statistical nature of luck, but one always hopes to find a pattern where some team is “making” their own luck.
- Since the teams are sorted by number of points (highest on the left), it is not surprising that the xG ratio trends pretty decently with the season points. We would expect teams that win more and therefore get more points for the season to also have better shots overall than they allow to their opponents. in 2023 we do have a few notable outliers (NYRB and Seattle) who had a really strong xG ratio but finished lower in points.
- MLS also shows an interesting trend where teams with high salaries (the blue bar) don’t always finish in the upper 1/4 of the league. In 2023, there are quite a lot of high salary teams in the lower 1/4, actually. This is very unlike what we’ll see in the next entry where we review the English Premier league results. Hard to put one’s finger on this completely, unless it has something to do with older European stars coming to MLS at the ends of their careers?
LINKS to Other Soccer Analytics Entries
- Soccer Analytics Series Intro
- MLS and Premier League Comparison
- Home and Away Luck Metric
- Does Counterpressing Work? Evidence.
- Evaluation of Outcomes using the Luck Metric
- More Analysis using the Luck Metric
- Soccer Analytics in Practice – Youth Soccer Example
- xG and Luck update on recent MLS season
- xG and Luck update on recent Premier League season