Thoughts on Motivation Management

AI generated Image “visualizing the management of worker motivation”

I mentioned in my last post on knowledge-work productivity that understanding how to manage motivation to do specific tasks will result in overall higher productivity. As someone who has thought about this (and experimented with approaches) for years, here are some of my thoughts:

  1. Set up Spaces Focused on Improving Motivation: This is a general idea to increase your productivity overall. It also includes the notion from my last entry on investing in quality tools. I’ve learned that it is not smart to skimp on the cost of tools (computers, notebooks, monitors, other work infrastructure) that are higher quality and are likely to give you joy to work with. Obviously, one can’t always have the best of everything, but if there are key, strategic tools that you work with, my experience is it is smart to spend the extra $50 or 100 bucks. Especially for a tool you may spend years working with. Key examples of this are 1) my mechanical keyboard – typing on this keyboard is satisfying in some weird way and I find that I’m unhappy working without it. 2) My noise cancelling Sony wireless headphones – What a lucky thing that I spent the money (they’re not cheap) right before COVID to buy these things… I originally had intended them for use on flights, but of course, COVID ended that idea and it morphed into use during Zoom calls. Was an absolute lifesaver for remote work and I was constantly grateful for them.
    1. In addition to quality tools, though, envisioning how your whole workspace could be “architected” to draw you in to work more effectively is time well spent. Things like KVM switches or USB hubs that allow the switching between computers are important for me, because they allow the quick, painless switching between a work computer and one or two personal computers. If you have a powerful personal computer (I use a Macbook Air and a powerful Linux workstation with big GPU’s) or two that are better for use with certain kinds of tasks, then the ability to switch common resources like the big monitors, mechanical keyboard, wireless mouse, or upgraded camera between them makes switching a breeze.
    2. Obviously things like a good chair and desk are important. Some people revel in their standing desks because it allows them to work in completely different contexts. I also like my office decorations (lots of tall ships and John Wayne paintings) because they make me happy to be in the office, which can improve my motivation to work.
  2. Track your Work: I think we all feel motivated when we make visible and measurable progress on a task. This, to me, is the chief value of a tracking schedule. I like checking off the boxes on a task! An example beyond the tracking schedule is the word count trackers that I use when I’m working on a book. I always have a daily goal to write some manageable number of words (usually like 100 or so) in the hope that I actually sit down, get in the zone, and crank out thousands of words. Knowing the value of visibility of work, I add to this a tracker where I have two columns, date and cumulative word count. I then do a simple line plot that shows the slope of my writing accomplishments. Some days, I write more and then get to see a steep slope of word count output for the day or week. This motivates me to keep it going! I refer to the word count tracker as a commitment device, but I also think of my IOS “Streaks” app (well worth the $3 or so on the app store) is also a commitment device that also helps build habits. And building habits gets us in that seat to do that writing (or gets us to the gym to lift, or reminds us to floss every day).
  3. Manage an Overall Work List: I have found that having a quite varied list of things that need to be accomplished helps with the times when I just don’t feel like doing anything. I’ve learned that when I feel this way, that I can almost always find something on the overall work list to do. If I’m feeling more like refinishing a piece of furniture than building the AI classifier for the dataset I’ve been looking at, I am able to work without any sense of guilt on the furniture. My experience is that there will come a moment when I’m very motivated to explore that dataset and if I ride the wave of that motivation, I’ll do the work much more efficiently.
  4. Know When You Work Well on Types of Tasks: I know that in the early morning, I’m much, much better at tasks that require creativity and challenge my thinking. Conversely, right around 2 PM after I’ve eaten lunch is NOT a good time for these tasks. I have found that 2 PM is better for walking around and doing gardening tasks or working on other more physical kinds of chores. Don’t fight these kinds of patterns!
  5. Celebrate Completed Work: I have a strong bias to finishing tasks that I’m working on instead of just pushing them forward a few steps. I think this allows one to be much more productive. So to support this, I celebrate completions. Perhaps finishing a major task means that I drive to Dairy Queen for a sundae. Or maybe it just earns me a short nap (I’m a big fan of the 13 minute nap for rejuvenation). The act of celebrating a completion is important and helps you build enthusiasm for the next task.
  6. Work to Identify how to fit your Motivation into an Employer’s Goals: OK, sometimes your employer doesn’t have the intimate knowledge of your motivation cycles and just wants you to work 9 hours straight on the most important tasks. If anyone is able to do this day after day, I’d love to know about you! Your employer isn’t really able to measure your productivity and assumes that measuring your hours-worked (and maybe how late you stay at the office) is the best proxy for productivity. Of course this is completely false. Any employer who cares at all about quality and productivity SHOULD be focused on tapping their employees’ best hours for the jobs. So many mistakes have been made by employees who were burned out, mentally exhausted, and working on activities they are far over-qualified for. Since the employer can’t manage this, somehow the employee needs to focus hard on maximizing their productivity through working tasks when they are most fit (and motivated) to work them. There is probably a whole lot more to be said about this, and possibly some of it would be controversial. I heard the quote once, “good employees do exactly what their employer tells them to do. Great employees conspire to make their employer astonishingly successful.” This is interesting to consider, especially in light of managing your motivation cycles.

Productivity and Cycle Time in Knowledge Work

Productivity
Productivity by Nick Youngson CC BY-SA 3.0 Alpha Stock Images
Creative Commons 3 License

Here’s a bit of a diversion from my normal data-oriented posts, but in a previous job, as a data-driven systems thinker it was natural for me to explore and try to understand how to measure productivity and cycle time. The work outcomes that the organization needed to understand better tended to be heavy on system design tasks but also extended into the work needed to set up product lifecycle cash flow.

Background on Productivity in Design Work

It was always a struggle to measure productivity (and cycle time) in this kind of environment, because it was extremely challenging to identify and measure the most important, value-producing events in the workflows. For instance, in system design, it was extremely easy to measure the productivity of one of the major bottlenecks in the process… (drum roll)… drafting! Why is drafting a bottleneck in the design of a system? Well, not only does someone in a factory have to assemble the product you just designed, but you also have to ensure that the supply base can be enabled and protected. Often the bill of materials on a drawing is the entry point for most of the complex activities performed by the supply chain organization. Additionally, quality needs to be protected and the “recipe” for building your system cannot be lost. All of these objectives, always made drafting a long, tedious process that designers and manufacturing engineers both expressed impatience. I went a bit long on this, but maybe you can see why productivity is easy to define and measure. The drafting team is working on one product, generally is not multitasking, and start work and complete work date and times are easy to capture – allowing the cost of the drafting product to be easily normalized by the hours spent (resulting in dollars per hour). Perhaps even the whole process can be measured from logs built automatically by the drafting software.

However, most of the rest of the design process is not so easy to measure. It spreads across many teams, all of whom have some sort of dependencies on other teams, each of which has it’s own “special sauce” and tasks which build upon tasks. Mastering queueing theory helps in manufacturing facilities where assembly tasks depend on multiple preceding steps is hard but doable because in manufacturing, the product is generally always visible to the eye. In design, however, the product can be ideas, processes, models, and pieces of documentation and is rarely visible in the same way.

So with that as background, I recommend the following YouTube video if you have interest in improving your true productivity in a “knowledge work” environment. I agree wholeheartedly, but watch the video and I’ll add my fourth principle to Cal Newport’s three that he offers.

DO FEWER THINGS – Cal Newport

OK. Did you watch the video? What does Cal offer up as his three principles?

  1. Do Fewer Things – Or better, “Do fewer things at once”. We all can chant “multitasking is a productivity killer”, but most of us still think we’re pretty good at it. Regardless, however, the point is not that you’re bleeding productivity, but that you’re probably doing things that have no impact on your life, your enjoyment of your work, and even on your final work product.
  2. Work at a Natural Pace – This doesn’t mean “work slowly” as one might imagine, but really involves something I think about as working as an extension of your life. How do YOU work best? Should you spend more time putting the thing you’re working on down and thinking about it more? Do you work better if you spend time to kit up the parts you’re assembling (or build UML models of the code you’re building) first?
  3. Obsess over Quality – I really like Cal’s point in the video that if one invests in quality tools (i.e., my Macbook that really makes me happy to code or write on) it’s a way for you to signal to yourself that your work is important and you ought to ensure you do the important parts as well as they have ever been done. He uses his grad school $50 lab notebook as a great example of this. How can one take lazy, incoherent notes in a really nice, expensive lab notebook (ostensibly with a very nice pen you’re proud of)??

My Fourth Category as Promised

Here’s Tod’s add. Maybe this is particularly me or maybe this is a pretty general thing, but here it is if it helps you.

4. Manage your Motivation: Your work productivity benefits (at perhaps an order of magnitude) when you are motivated to do it. For years I have pondered the difficulties and tricks for optimizing motivation cycles and have found that I do fabulously better work when I am “all in” on getting that work done. Sometimes, of course, one unfortunately doesn’t have the option of working on the “blue widget” when the motivation hits because the boss is impatient. But I’m going to guess that during those times, “blue widget” productivity and quality suffer significantly because they’re being worked on out out of obligation and not desire. Perhaps these times correlate strongly with surfing Reddit or YouTube?

It is also impractical if your ability to manage your motivation is weak and your motivation cycles are too sporadic. A cursory scan of my blog would probably reveal that I love to write (see my series on self-publishing). Unsurprisingly, I find that I write my most interesting and creative passages when the motivation to write hits, but I have also learned that I really need to create “commitment devices” to help ensure that I can channel that motivation into daily writing sessions. I imagine (or hope) that this is universal, as I have heard similar things from other writers or musicians.

Recap

Productivity in knowledge work is really hard to get one’s head around. It’s hard to define, difficult to measure (and automate measurement), and really challenging to normalize cost with the hours spent on the task. It feels like Cal Newport’s suggestions won’t necessarily resolve this difficulty, but it might allow the improvement of productivity — measurement aside — by focusing on the productivity of the most critical parts of the task.

Major League Baseball – Did Banning “The Shift” work?

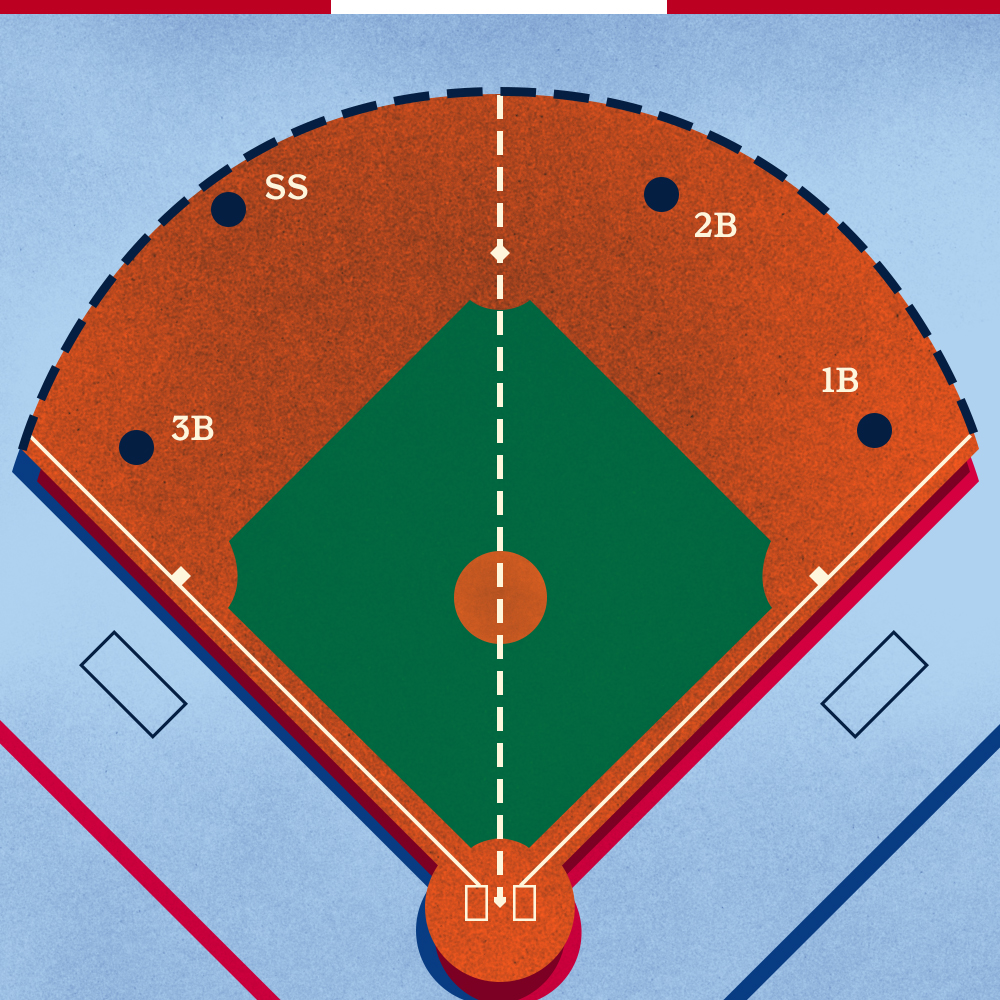
Positioning of infielders under new rules'
image from https://www.mlb.com/glossary/rules/defensive-shift-limits

Abstract

in 2023 Major League Baseball made a rule restricting certain defensive players being in certain portions of the field (See here for the actual definition of the rule). This was done to combat “The Shift“, a defensive technique which was popularized by the Tampa Bay Rays in 2006, where one side of the field is overloaded with players.

I had the notion at the time that banning the Shift was just a band-aid measure and would have no impact. Since the ban was in 2023, we have had one full season to evaluate any impact of the ban.

History of The Shift

The idea of shifting players to counter power hitters’ tendencies to pull the ball to one side goes to the early parts of baseball. It disappeared for a long time, however, until Originally, the Rays’ had the idea on how to shut down David “Big Papi” Ortiz of the Boston Red Sox, a left handed hitter who had great power pulling the ball down the right side of the field. Joe Maddon, the manager of the Rays, used Sabermetrics to identify that Ortiz hit nearly every time to the right side, and mostly to the outfield. The ploy was effective and Ortiz, who had hit over .300 from 2004 to 2006 moved to .265 midway through the 2006 season after multiple teams started copying the Rays’ technique against him.

The Shift attracted a lot of fan attention because it was often deployed against the most well-known power hitters and was seen as stifling to the offensive aspect of the MLB. Eventually, it was banned (limited, actually, see the definition above for detail) and the 2023 season was the first to be held without the old, dramatic version of the Shift.

See below for an image of the Shift being applied by the Angels (there’s an extra person in the shortstop position).

Hypothesis

Image from Wikimedia Commons – By Jon Gudorf Photography – https://www.flickr.com/photos/jongudorf/16802945985/, CC BY-SA 2.0, https://commons.wikimedia.org/w/index.php?curid=112638138

Based on the way the Shift was deployed, I figured that if I wanted to demonstrate if the rule banning the Shift had any effect, I would have to evaluate the performance of elite power hitters both before and after the ban. This is not a perfect approach, though, because what if some other variable was introduced (a new “juicier” ball? Rules restricting pitchers) that impacted hitters’ performance. This means that I would have to evaluate performance differences of groups of “non-sluggers” as well to detect any non-Shift related performance changes.

I’m defining sluggers (the ones most impacted by the Shift) as hitters who have a Slugging Percentage (a common measure that records the total number of bases coming from hits) greater than the league’s average. My inclination is that the true sluggers are the ones who are at least one standard deviation above the mean (i.e., the top 16% of hitters.

Data Gathering

I used the Python library, pybaseball, to scrape some basic data. Pybaseball is useful in that it scrapes multiple baseball stats sites (including advanced pitch-based metrics). I only needed it to pull data on at-bats, hits, doubles, triples, home runs, and walks from 2006 to today’s date in 2024.

The data was pulled in two groups. One represented the “post-Shift” era from 2006 to 2022 and the other represented the “post-ban” era from 2023 to the current date. Data was evaluated by player and then normalized by the number of at bats. Multiple minimum at-bats were used (400, 600, 800) to determine impact of the Shift on players regardless of their usage on the team (but my insight was to not go much lower than 400 at-bats, in the theory that players who had few at-bats were unlikely to have the shift deployed against them (as it appeared to be reputational). Both groups were separated into two types of players, 1) “Normal” players, who’s Slugging Percentage numbers were close to the league mean and 2) “Sluggers”, who’s Slugging Percentage was a) in the top half of the league, b) one standard deviation from the mean (top 16%), c)_two standard deviations from the mean (top 5%), and c) three standard deviations from the mean (top ~1%). The notion is to identify if any of these groups of “sluggers” statistics (Hits, Doubles, Triples, Home Runs, Walks) were statistically different between the pre-Shift group and the post-Shift group.

Results

The first thing I looked at to compare performance from the “Shift Era” to the “Post-Shift Era” was the mean value of a number of common metrics. I selected ones that I felt were most likely to be impacted by the Shift. Hits, Doubles, Triples, Home Runs (the Shift doesn’t really impact Home Runs.. but I was curious), and Walks. I normalized these metrics by the number of at-bats for every player to make sure to keep things consistent.

Top 16% of Sluggers Compared Before and After the Shift was Banned. Also non-Sluggers for Comparison

I did this for a range of Minimum At Bats and Numbers of Standard Deviations away from the mean to define who was a “slugger”. They all looked a bit like this. The first thing I notice is that the period after the Shift was banned sees better offensive performance (and more walks) across the board. Great! We have an answer! No? Of course it’s never that simple. First off, we need to remember these are just the mean values for these eras and the mean of a distribution is not always the best way to describe the whole distribution. Also, we need to understand if these differences are significant or could just be explained away by common variation.

The next step was to apply an algorithm called the Kolmogorov-Smirnov two sample algorithm. This test compares the underlying continuous distributions F(x) and G(x) of two independent samples (pre-ban and post-ban) to determine if they come from the same distribution (our base assumption) or if they were drawn from different distributions. To wit, do the performance metrics before the Shift was banned have a fundamentally different distribution than the metrics after the ban. We will establish a required confidence interval of 95% (the typically accepted number) before we can determine the distributions different.

p-values comparing Sluggers before and after the ban. The red line is our confidence interval. Any bars below the red line indicate that metric is statistically different before and after the Shift

Above you can see the p-value for just Sluggers (top 50% of sluggers on the left, top 16% in the middle, and top 5% on the right) before and after the ban. We already know that the offensive metrics tend to be higher after the ban, this just tells us if that difference is significant and if it extends to the whole distribution.

p-values comparing non-sluggers before and after the ban. The red line is our confidence interval. Any bars below the red line indicate that metric is statistically different before and after the Shift

Analysis of the Results

There are obviously more charts, but these tell the story well enough. In the top chart (comparing Sluggers’ performance), we see that for the top 16% of sluggers, their performance on every metric other than doubles meets our requirements to claim that the differences are statistically significant. However, it’s hit or miss (pun!) for the other two clusters. Hmm.

Then looking at the non-slugger comparisons (we are comparing the hitters in the lower 50%, 84%, and 95%), we see that there are fundamental differences almost in all categories (most of the bars are below our red line, indicating that the performance changes in these metrics are significant), clearly more than with the sluggers! This indicates to me that something OTHER than the Shift has been responsible for affecting offensive performance across baseball. The Shift was rarely or never applied to any players other than pull-hitting sluggers, so it couldn’t be responsible for the performance changes we see in this bottom graph.

Conclusions

  1. It seems pretty straightforward. Offensive performance has changed across the board between the time period from 2006-2022 and the time period from 2023 on. These are a large number of years, and lots of rule changes could have happened.
  2. However, the changes in performance have been consistent across all hitters in MLB, not just the sluggers.
  3. In actuality, the Sluggers seem to have had a less significant increase in performance than the non-Sluggers.
  4. All of this makes me say that the performance impacts was from factors other than the banning of the Shift and that my initial hypothesis that the banning of the Shift had no impact is true.

To see others of my recent sports analytic posts: