Here’s the latest update on the current COVID-19 outbreak with backing data. I’ll show a number of different views of the data, including some extra focus on the Arizona data since I have my best data from my own state. Always happy to take requests from folks from other states.
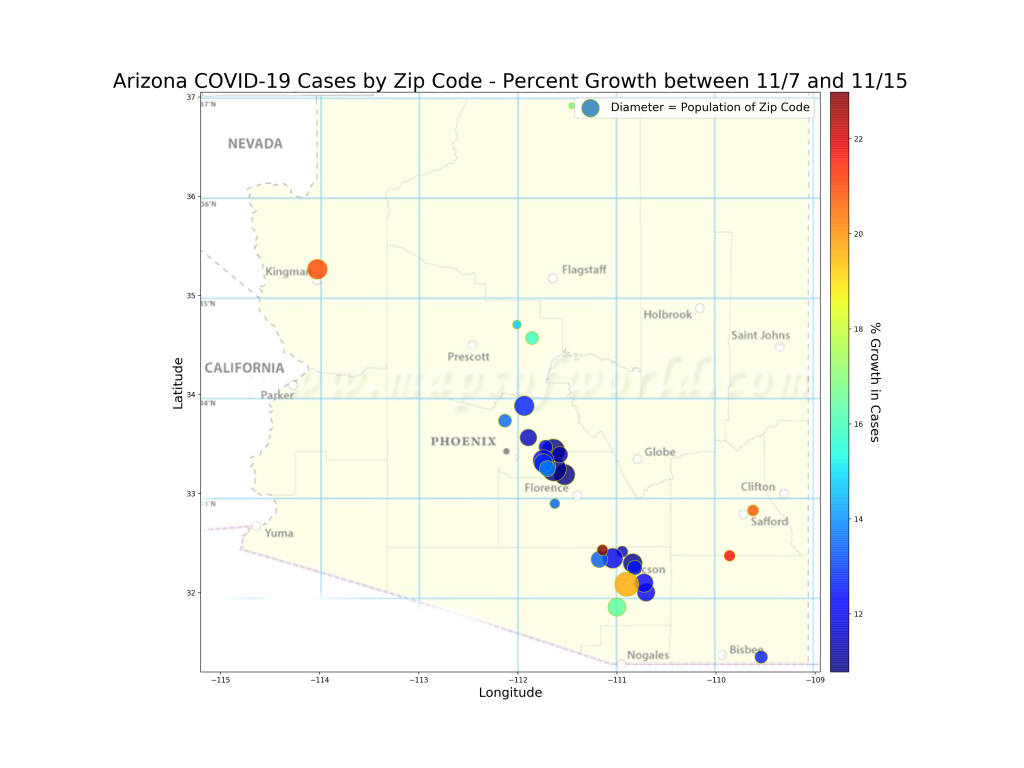
Arizona COVID-19 case growth by Zip Code – 11/7 through 11/15
Note below that we’re still not seeing a whole lot of repeats in the top 30. I think that some geographic areas are surging and then slow down. This week a new zip code from Pinal County is now at the top with 20 percent growth, but since their numbers were already very small, it’s probably not as relevant as 85756 in Pima County, which is the first county that has shown up recently in the top 30 this fall that had significant cases in the summer. It is a relatively large zip code in population, as evidenced by the large orange bubble below. If you look closely, it does appear that the majority of the top zip codes have a relatively young median age. The main exception is 85614, which is a Green Valley zip code and has a median age of 68.


Case Growth Across Arizona over the Last 2 months
Note that 85719 (home of the U of Arizona) stands out over the last 2 months. Fortunately, due to the low median age in this zip code, there appear to have been no deaths and few hospitalizations in this zip code for all these cases. It’s also fairly certain that many of the cases in this region were false positives due to this zip code being the first to use the U of A’s antigen tests, which have been demonstrated to have high false positives. 86001 in Flagstaff also has a major university, and thus, higher case growth over the last 2 months. Initially, during September, 85009 from SW Phoenix had high case growth, but it slowed down and this zip code is no longer in the top zip codes for case growth.

Arizona Cumulative Case and Death Curves
I like looking at the data this way because it becomes clear if growth rates are linear or if they are increasing non-linearly (the upward curve). Right now, we’re seeing nonlinear growth in Arizona cases, but probably more like linear growth of deaths. Deaths seem to be increasing at a rate of about 23 per day, which seems to be just slightly above the average since 9/11. Cases however are increasing non-linearly and the instantaneous slope today is around 2100 new cases per day. It’s hard to tell at this stage because things can change quickly, but it’s possible that the slope of this phase of the outbreak is lower than the slope from the start of the summer outbreak (around June 14th).

Arizona Hospitalization Status
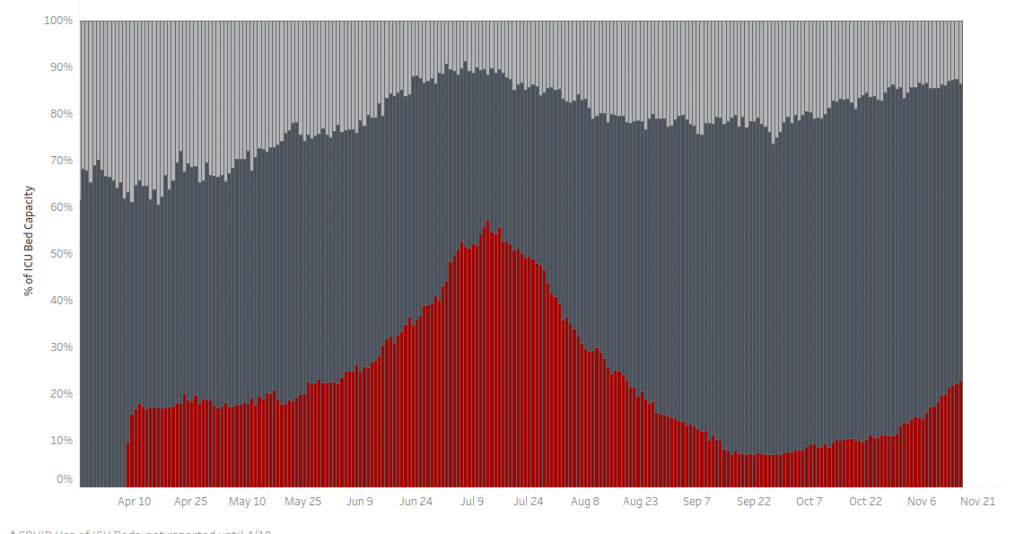
I have been hearing word that the hospitals are heavily burdened by COVID cases again. This is likely very true and may be different in different localities. However, at a state level, there is still no need to be afraid. Here is the ICU Bed status for the State from the state Dept of Health Services dashboard. The increase of COVID patients has been nonlinear since October, but the numbers are still around 20% of the state’s ICU bed capacity. I expect that the grey bars will get squeezed by COVID before this outbreak is over (much like it did in early July).

US State Case Growth Rates
These tables allow you to see case growth rates as well as cumulative case and death numbers per 1000 people. Note that North and South Dakota are still right in the middle of the fight and their case acceleration rate is still quite high (Montana is catching up).


