

Recently I realized that I have all the information I need to calculate the Reproduction Number – Ro – of the COVID-19 virus across each country. The method to do this was simple, the SIR model. This is a very simple infectious disease model that assumes that each member of a population is either susceptible, infectious (infected with the disease) or recovered from the disease with a specified re-infection parameter. This model, while simple, is seen as appropriate as a very simple model for seasonal influenza, ignoring features such as immunity from past infections.
The thing about Ro that hasn’t been adequately discussed is that it can change from day to day and from location to location. The reason we care about Ro is largely because we desire to compare the rates of infection of various diseases to each other. for example the Ro of measles is very high, about 12 to 15. Influenza’s Ro is often estimated after an outbreak to be between 2 and 3.
In the 1950s, epidemiologist George MacDonald suggested using Ro to describe the transmission effectiveness of malaria. He proposed that, if R0 is less than 1, the disease will die out in a population, because on average an infectious person will transmit to fewer than one other susceptible person. On the other hand, if R0 is greater than 1, the disease will spread. Many news stories in the early phases of this outbreak have speculated that the Ro of COVID-19 was up around 2.5 to 3. This is very simplistic way of looking at transmission, however, due to the existence of “super spreaders” who for unknown reasons may spread infection to hundreds or more people. This type of non-linear spreading is hard to model.
In the SIR model, there is a parameter β that is defined as the disease transmission rate constant. The Reproduction number (Ro) is most simply defined as the transmission rate (β) multiplied by 1/γ (the mean infectious time). This mean infectious time is about 5 days for influenza but I don’t think anyone has a good idea what it is for COVID-19. Due to this, for now, I’m going to go ahead and assume 14 days, which is the standard quarantine number.
To show the math, the SIR consists of three differential equations:

My insight is that I have been calculating the derivatives (dxs/dt) for a while as the instantaneous rate of change for confirmed cases. With that as a known and xs, xi, and xr, being the confirmed cases, active cases, and recovered cases respectively, all I needed to complete that equation was β and the reinfection rate (rR->s), which is anyone’s guess at this point. Therefore, assuming two parameters, 1) the reinfection rate being a small number (0.001) and 2) the mean infectious time to be 14 days, I can now calculate Ro for each locality on any day during the outbreak.
Results
When I ran the above calculations on my COVID-19 data to back out the Ro value for each location I arrive at the below results for the top 15 regions. Again, this is calculated for today’s data. Undoubtedly, Italy and Spain had numbers similar to the top regions on this list about 2-3 weeks ago, but comfortingly, we see Ro go down to one or below once a region has pushed through their first wave of infections.
In the table, Ro is the far right column. Note that San Marino has gotten their deaths under control but they’re going through another large wave of infection (has a lot to do with their small size and communal nature). You can see in the larger countries that a Ro larger than one is leading to large changes in active cases. Also, of note, since transmission is the goal of Sweden, we’re seeing their Ro moving above one too. I suspect theirs will continue to increase for a little while.
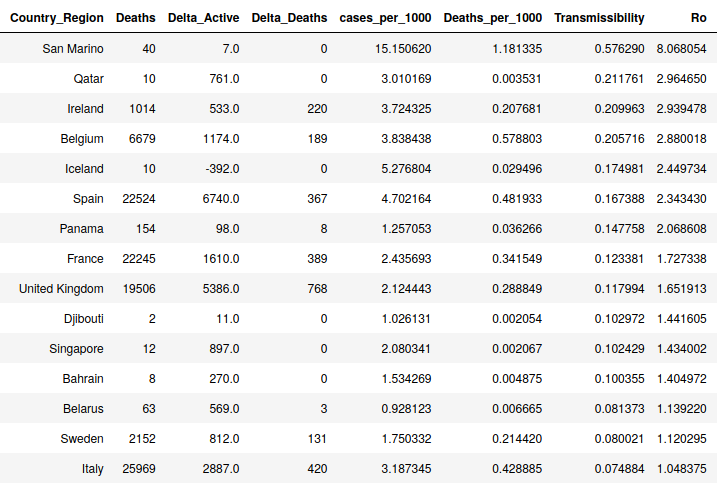
Caveats: First off, because the US isn’t doing well at capturing Recovery numbers, I’m not including them in this table. Second, this is not the most scientific assessment because I have zero control over how the data is collected and barely much more insight into the methodologies of the countries. If I was to be asked what a good general number for the Ro for COVID-19 was I would pick Iceland’s number of 2.45 because I understand their methodologies for counting cases and infections and don’t believe there are large discrepancies. I believe Belgium’s numbers for the most part too, as they’re definitely not undercounting. Nearly all other countries are suspect at some level.
Updates
Note, the table above was from two days ago. When I update for 4/26/2020 data the table changes a bit. Honduras is interesting to watch to see if this is anomalous or not. See below.
