Decoding the Data: A Visual Guide to Soccer Player Trends

premier league playing time trends panel

Breaking down the six-panel dashboard that reveals the hidden differences between Premier League and MLS


In our previous analysis, we discovered that MLS offers more stable career opportunities than the Premier League despite being considered a “lower-tier” league. But how exactly did we reach this conclusion? Let’s walk through each visualization in our trend analysis dashboard and highlight what makes these leagues so fundamentally different.

premier league playing time trends panel
Premier League playing time trends (2022-24) panel
MLS Playing Time trends panel
MLS Playing Time Trends (2022-24) Panel

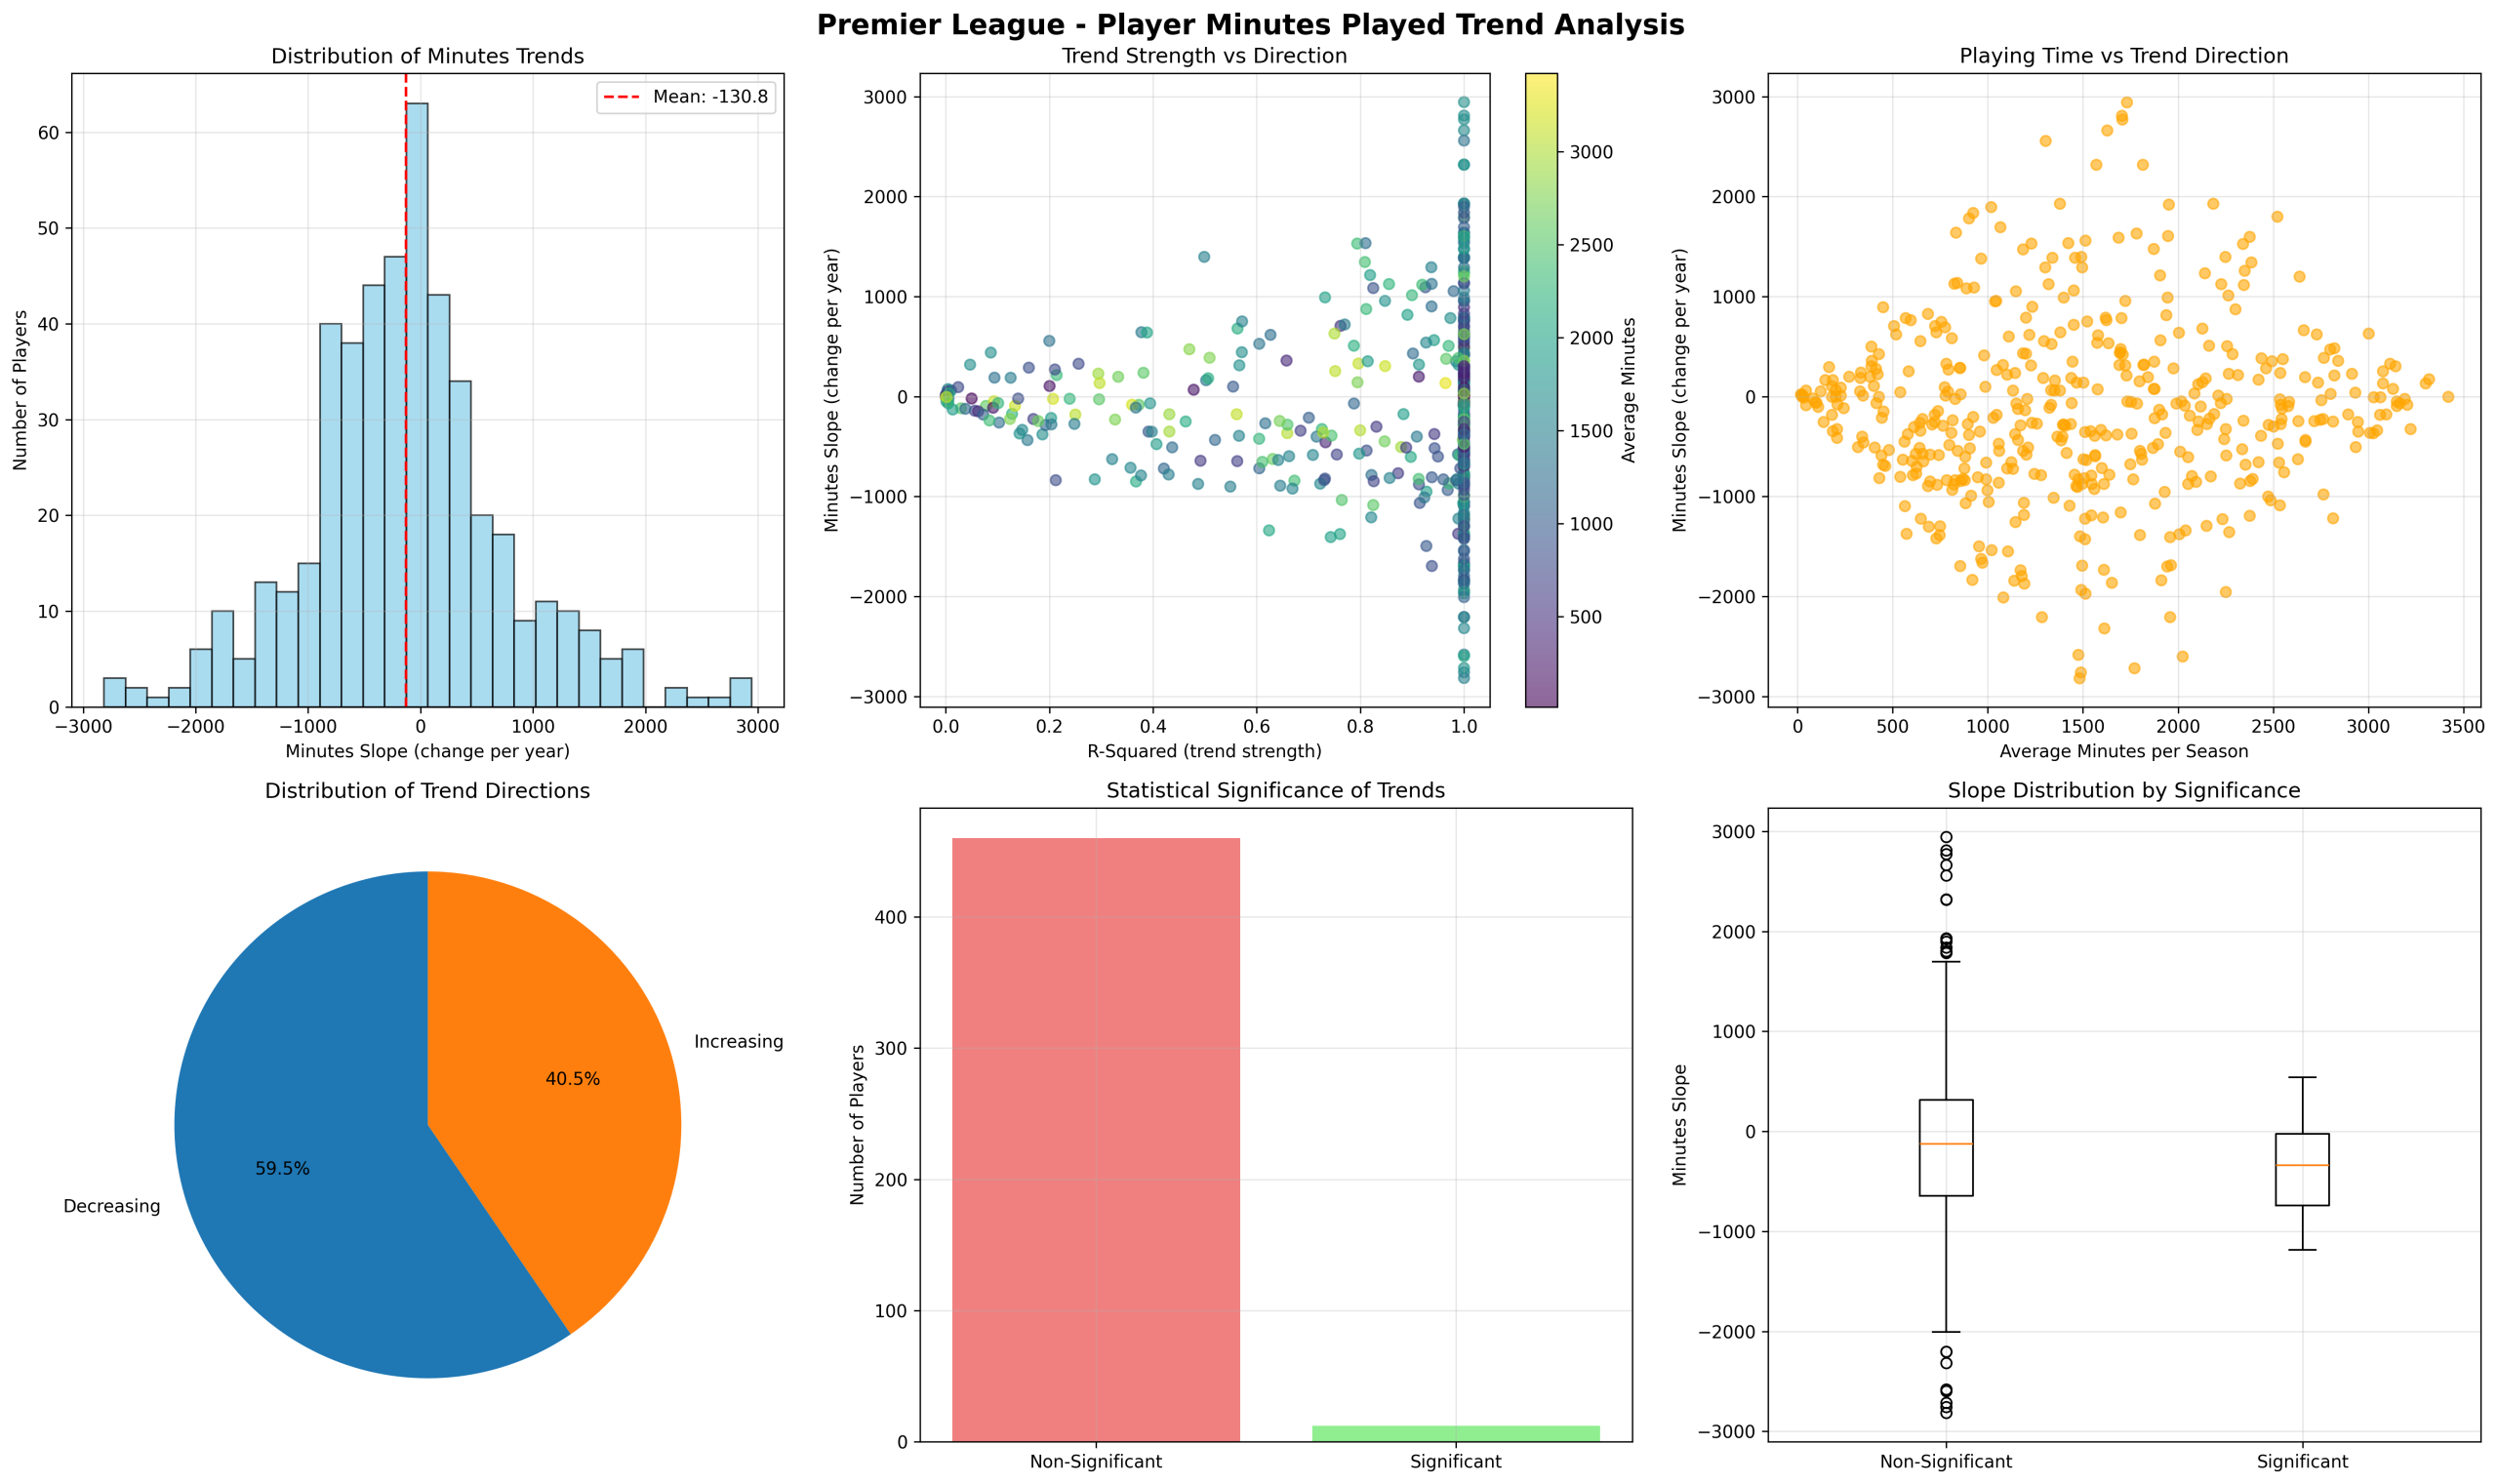
The Six-Panel Story: What Each Chart Reveals

1. Distribution of Minutes Trends (Top Left)

The Foundation: Where Every Player’s Story Begins

This histogram shows how many players are gaining or losing minutes each year across the entire league. Note that these bars describe a CHANGE in playing time over the years of the study.

Premier League: Sharp peak of change in playing time around -130 minutes/year with a mean of -130.8

  • Most players are losing playing time consistently
  • The distribution is skewed left, showing more declining players than improving ones

MLS: Perfectly centered around zero with a mean change in playing time of just -4.0

  • Nearly balanced between players gaining and losing minutes
  • Much more stable environment overall

Key Insight: The Premier League actively pushes most players toward fewer minutes, while MLS maintains equilibrium. We discussed some possible reasons for (and consequences of) this in our previous post.

2. Trend Strength vs Direction (Top Middle)

The Reliability Test: Which Trends Can We Trust?

This scatter plot maps trend direction (x-axis) against statistical reliability (y-axis), with color showing average playing time. We use the metric R-squared to describe how our linear regression line “fits” the actual data. A R-squared of 1 means the regression line perfectly describes the data.

Premier League: Scattered, chaotic pattern with few high R-squared values

  • Most trends are statistically unreliable (low R-squared)
  • Even dramatic changes might just be random variation

MLS: More structured patterns with slightly higher R-squared clustering

  • Trends are somewhat more predictable and reliable
  • When changes happen, they’re more likely to be “real”

Key Insight: MLS player trajectories are more predictable, while Premier League careers are subject to more randomness. Check our previous post for fuller analysis of why this might be happening and what it might mean.

3. Playing Time vs Trend Direction (Top Right)

The Democracy Test: Do Stars Get Special Treatment?

This scatter plot reveals whether high-minute players (established stars) have different trend patterns than bench players.

Both Leagues: Remarkably similar scatter patterns between MLS and EPL.

  • No clear correlation between current playing time and future trends
  • Even established starters can see declining or increasing minutes
  • We do see much less variability in the “slope” of the change of playing time over 3 years for the least-used and most-used (stars) players.

Key Insight: Both leagues show “democratic” opportunity distribution—your current status doesn’t guarantee your future trajectory, but the more minutes you play, after a point, the less likely you’ll see a large change in your playing time.

4. Distribution of Trend Directions (Bottom Left)

The Balance Sheet: Winners vs Losers

Simple pie charts showing the percentage of players with increasing vs decreasing minutes.

Premier League: 59.5% Decreasing vs 40.5% Increasing

  • Clear bias toward player decline
  • “Survival of the fittest” mentality

MLS: 50.5% Decreasing vs 49.5% Increasing

  • Almost perfect balance
  • More “rising tide lifts all boats” approach

Key Insight: This single chart captures the fundamental philosophical difference between the leagues.

5. Statistical Significance (Bottom Middle)

The Reality Check: How Much Is Just Noise?

Bar charts showing how many trends are statistically significant versus random variation.

Premier League: ~95% non-significant trends

  • Most changes are just rotation chaos and random variation
  • Very few predictable career patterns

MLS: ~90% non-significant trends

  • Still mostly unpredictable, but slightly more reliable patterns
  • Some genuine career trajectories emerge from the noise

Key Insight: Both leagues have unpredictable elements, but Premier League chaos makes career planning nearly impossible.

6. Slope Distribution by Significance (Bottom Right)

The Magnitude Question: Are Real Trends Bigger Than Random Ones?

Box plots comparing the size of statistically significant trends versus random variation.

Premier League: Similar box sizes between significant and non-significant

  • Even “real” trends aren’t much larger than random fluctuations
  • Extreme outliers in both categories

MLS: Slightly wider “significant” box

  • When trends are real, they tend to be more substantial
  • Less extreme random variation

Key Insight: MLS rewards patience—real trends are more distinguishable from noise.

The Visual Story: What It All Means

Premier League = High-Stakes Casino

The charts paint a picture of a league where:

  • Most players are on declining trajectories. New, skilled players are always arriving.
  • Randomness dominates over predictable patterns
  • Career planning is nearly impossible
  • High rotation and pressure from younger players coming from all over the world create constant uncertainty

MLS = Balanced Ecosystem

The visualizations reveal a league where:

  • Players have genuine development opportunities. Pressure from skilled, new arrivals is much lower.
  • Trends are somewhat more reliable and predictable
  • Career trajectories can be planned and managed
  • Stability allows for longer-term thinking

Reading Between the Lines

The Economics Show Up in Every Chart

You can see the Premier League’s financial pressure in every visualization:

  • The negative trend distribution (constant upgrades)
  • The chaotic scatter patterns (rotation due to multiple competitions)
  • The low significance rates (panic-driven decisions)

MLS’s Constraints Create Opportunity

The salary cap and roster rules manifest as:

  • Balanced opportunity distribution
  • More reliable trend patterns
  • Genuine player development curves

Practical Applications

For Players: Use these charts to understand which league environment suits your career stage and goals.

For Analysts: The significance rates tell you which trends to trust for predictions.

For Fans: These patterns explain why your favorite player’s role might be more stable in MLS than you’d expect.

The Bottom Line

Six simple charts reveal a profound truth: league structure fundamentally shapes individual careers. The Premier League’s unlimited resources create chaos, while MLS’s constraints foster stability.

Sometimes the most important insights come not from complex algorithms, but from carefully visualizing the simple question: “Are players generally getting more or fewer opportunities over time?”

The answer, as these charts clearly show, depends entirely on which side of the Atlantic you’re playing.


Next up: Individual player spotlights showing which specific players are beating the odds in each league’s unique environment.

Blog Posts in the Playing Time Analytics Series:

The Tale of Two Leagues: What Player Minutes Data Reveals About Premier League vs MLS

premier league playing time trends panel

A deep dive into how league structure and economics shape player career trajectories


When we think about the differences between the English Premier League and Major League Soccer, we usually focus on the obvious: prestige, talent level, global reach. But what if I told you that the most revealing differences lie hidden in something as simple as playing time trends?

Using advanced statistical analysis of player minutes over multiple seasons, I uncovered some interesting patterns that hint at the fundamental DNA of these two leagues. The results are more fascinating—and counterintuitive—than you might expect.

The Numbers Don’t Lie: A Study in Contrasts

After analyzing thousands of players across both leagues from 2022-2024, the data tells a clear story:

Premier League: The Decline Machine

  • Average player loses 131 minutes per year
  • 60% of players see decreasing playing time
  • Highly unpredictable rotation patterns
  • Indication: “Win-now” mentality dominates

MLS: The Stability Engine

  • Average player loses only 4 minutes per year (essentially flat)
  • Perfect 50/50 split between rising and declining players
  • More predictable career trajectories
  • Indication: Development-focused approach

The Opportunity Paradox: Why Less Money Means More Chances

Here’s the counterintuitive finding: MLS, despite being a “lower-tier” league, actually offers more stable career opportunities than the world’s most prestigious soccer competition.

The Premier League’s Brutal Economics

In the Premier League, money and prestige creates chaos. With transfer budgets exceeding $200 million and relegation costs around the same figure, clubs operate in constant panic mode (Man U, looking at you). The result? A “disposable player” mentality where:

  • Aging curves hit like a cliff – one bad season and you’re replaced.
  • Heavy rotation due to multiple competitions (Premier League, cups, Champions League)
  • Global talent influx means constant competition from new signings. There are players in lesser leagues all around the world eyeing your spot!
  • Managerial pressure leads to frequent tactical changes and lineup shuffles. Average tenure of an EPL manager is down to somewhere around 800 days!

All of these disruptive factors can be observed in the playing time trends across seasons

MLS’s Forced Patience

MLS’s salary cap ($5 million per team) and unique roster rules create an entirely different dynamic. Yes, there are negatives, but there are also some positives regarding player development:

  • Limited upgrading ability forces teams to develop existing talent
  • No relegation reduces panic-driven decisions and relegation-based “unloading” of players
  • Designated Player rule (only 3 “superstar” signings) emphasizes squad depth
  • Draft system creates investment in domestic player development

What This Means for Players

Premier League: High Risk, High Reward

If you can survive the craziness of Premier League rotation and competition, you’re likely exceptional. But the data shows most players experience declining opportunities over time. It’s a league that chews up talent and spits it out. Even the best players can struggle to find a fit on a high-performing EPL team.

MLS: The Developer’s Paradise

MLS offers something increasingly rare in modern soccer: time to develop. Players get longer leashes, more consistent opportunities, and genuine chances for comeback stories. MLS Next Pro is now standing up as a developmental league and the USL Academy is also ramping up development of players who might be expected to play in the USL or MLS.

The Bigger Picture: League Structure Shapes Destinies

This analysis reveals a profound truth about modern soccer: financial inequality doesn’t just affect competitive balance—it fundamentally alters how players’ careers unfold.

Some Quick Thoughts on Lessons for Different Stakeholders:

Young Players: Might be best off to consider MLS for development opportunities, even if it means lower initial prestige

Fantasy Soccer Players: Premier League minutes are nearly impossible to predict; MLS offers more reliable patterns. Perhaps this is meaningful or not, but playing fantasy at a high level means understanding what about the sport is predictable and what is not.

Talent Evaluators: Players succeeding in Premier League’s chaos demonstrate exceptional adaptability. EPL teams in general are using these kinds of analytics to evaluate upcoming players who have survived the meat grinder.

League Administrators: Salary caps and roster rules can actually improve player development environments. Not sure if the MLS cares about this as much as the rules’ influence on the bottom line, but I find it interesting.

The Statistical Deep Dive

The trend analysis used linear regression to track each player’s minutes change over time, revealing:

  • Statistical significance: MLS trends are more reliable and predictable
  • Extreme outliers: Both leagues have dramatic success/failure stories, but Premier League outliers are more likely to be noise
  • Career stability: MLS players can better predict their role evolution

Looking Forward: Implications for Global Soccer

As soccer becomes increasingly globalized and commercialized, these findings suggest we might need to reconsider our assumptions about league quality and player development.

The Premier League model—unlimited spending, constant roster turnover, high-pressure environment—may be great for spectacle but potentially problematic for sustainable player development.

The MLS model—constrained spending, forced player development, balanced opportunities—might offer lessons for other leagues seeking to optimize talent cultivation.

Conclusion: It’s Not Just About the Money

While the Premier League will always attract the world’s best talent through prestige and wages, this analysis shows that more money doesn’t automatically mean better opportunities for most players.

MLS, with its salary caps and development focus, has accidentally created something valuable: a league structure that gives players genuine chances to grow, adapt, and succeed over time.

In an era of increasing player burnout and shortened careers, perhaps there’s wisdom in the MLS approach. Sometimes, constraints breed opportunity.


This analysis was conducted using data from FBRef.com, followed by statistical trend analysis across multiple seasons.

Want to dive deeper? The complete dataset and visualizations reveal even more fascinating patterns about age, position, and team-specific trends that continue to challenge conventional wisdom about player development in modern soccer.

Playing Time Trend Analysis Charts for EPL from 2022-24
Playing Time Trend Analysis Charts for MLS from 2022-24

Blog Posts in the Playing Time Analytics Series: