

The state AZHS Dashboard provides a download and a map of COVID-19 Cases by Zip code. I was playing with the data and noticed that most of the regions with higher cases per 1000 were areas that were known to have lower median incomes. This intrigued me, because we really don’t know much about who is involved in this current wave of COVID-19 infections (other than the age demographics that I presented in previous articles).
COVID-19 Outbreak Info by the richest and poorest zip codes in Arizona
First caveat… due to tribal regulations, I have zero data for tribal regions, many of which would qualify as areas with very low median incomes. This is too bad and if anyone from these regions is interested in having their data analyzed securely, please contact me.

My thoughts on this chart:
- It is pretty clear that COVID-19 outbreaks are much higher in Zip Codes with lower median incomes. The yellow trend line on the chart shows a R2 score of just under 0.5, which indicates that the trend is a pretty solid fit considering this is real-world data. The average number of cases per 1000 in the poorest 20 zip codes is over 9 and the average of cases per 1000 for the richest 20 zip codes is 1.9. Even if you subtract the Yuma and Nogales zip codes that have some of the highest case rates in the country, the average for the 20 poorest zip codes is 6.5. I posted this chart on Facebook looking for theories on why the situation is this pronounced. There was a lot of good discussion about this, and it is clear that whatever is causal for this disparity, it is comprised of multiple cultural and economic variables.
- Lots of businesses that were shut down during the state’s COVID-19 lockdown (gyms, restaurants, and even churches) probably have a much higher representation in the wealthier zip codes, where very large gyms, restaurants, and churches thrive. This would be an interesting study. It does seem like the current outbreak probably has much less to do with these kinds of businesses than we would have guessed.
- Some of these regions that have much higher cases per 1000 people are agricultural areas. Most of these particular regions also have a very low death rate. Perhaps there’s something they’re doing that makes them more likely to get infected but less likely to be badly affected.
- I also suspect that one influential variable is mask usage. My observation in Tucson is that the Foothills region has been much more diligent around face coverings than other parts of Tucson (and certainly rural Arizona). This may be one reason the Tucson Foothills zip code COVID-19 cases per 1000 are extremely low. This may also apply to regions in Phoenix that are similar to the Tucson Foothills.
- Now that Pima and Maricopa county are mandating face coverings in public, we have a great opportunity for a natural experiment on the value of Face Coverings. My guess would be that we’ll see the case count flatten out in about two weeks. The question is whether this would have happened anyway. Hopefully we can compare mask vs. no mask regions afterwards.
Zip Codes with the largest Percent Increases in COVID-19 Cases
Arizona had a few really big case numbers in the days since I posted my first chart comparing cases with median income. Below are the zip codes that had the highest percent increase in the last 2 days. As you can see, these areas of fastest increase are generally in lower-income areas.

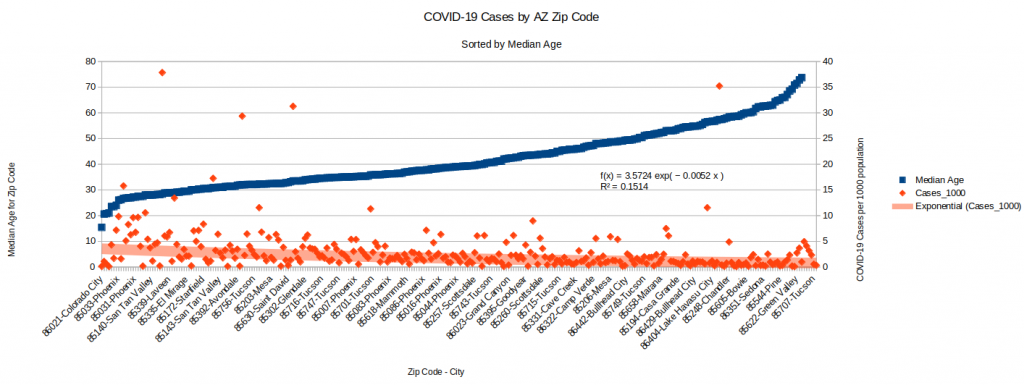
COVID-19 Cases by Zip Codes Sorted by Median Age
Unsurprisingly, the zip codes that trend younger are also showing a higher case count in general. This aligns with data where we see the 20-44 age group far outpacing the others in new cases. Interesting trivia: Based off the data from usa.com (came from the American Community Survey of 2010-1014), Colorado City’s median age is 15.
COVID-19 Cases Plotted Against Population Density
Following a similar approach, I also put together a scatter plot showing COVID-19 Cases per 1K people plotted against the Population Density of a Zip Code. The trend is one of the strongest yet (the R2 Coefficient is .29 which is usually pretty decent with non-laboratory data). Not a real surprise, but I imagine that density might be a good proxy for large apartment complexes. I’m thinking about ventilation, etc., when I wonder if people in apartment complexes (perhaps less expensive ones have poorer filtration?) have a higher risk of becoming infected with COVID-19.

Hey Tod,
Interesting post. I was curious if this median income data could somehow be combined with median age data. I too have noticed much more mask diligence in the Foothills than the rest of the city (prior to the mandate). I’ve anecdotally attributed this to the age of the Foothill residents (I don’t even know for sure the Foothills has an older median age). As you’ve said before mask usage seems to have a definite political discriminant, but also an age discriminant. The thought would be that older people seem to be more likely to wear a mask, therefore leading to a lower infection rate in communities with a higher median age.
Take care and thanks,
Chad
Hey Chad. Yes, but it takes a ton of work. The state does not have good data available, so I’m having to pull data by hand from various web sites. I think there’s an age factor in the Foothills (65+ people BETTER be wearing their masks) but also a political identity issue. I suspect the reason the 65+ case growth trend is basically linear (compared to any other age group) is due to face mask usage. We’ll see their impact in about 10-14 days as we start to see data post-mask-mandate.
T.
Couple of points I noticed:
85755 in Tucson in your list is not what I would call a lower-income area as that is in Oro Valley – so perhaps an outlier on that list. I will say having gotten take-out in the area (as it’s not far from me) I noticed little mask usage and the average age there tended to be in the 45-65 age range I would guess of the patrons I saw packing a bar or sitting indoors at a restaurant to eat, all unmasked.
I had thoughts about the ventilation issue too and looked at a number of papers and recent articles, but the point I can’t get around is – it’s still influenced by introducing COVID-19 into the area with poor circulation. Having poor circulation or filtration in your home isn’t enough to contract COVID-19 if it isn’t introduced to the environment – so there are behaviors that are still not necessarily low risk (lack of mask wearing or social distancing) that has to still be involved with a filtration/circulation method for contraction.
Thoughts?
Interesting. I hadn’t looked into 85755 much because it had a low cases per 1K rate. It shows about 50% growth because it went from 33 cases to 50 in just a couple of days. So maybe not interesting yet (I plan to re-run the zip code data at the end of the week… we’ll see if they’re still increasing). There definitely seems to be more emphasis on masks in places like Whole Foods than Frys… that might be an interesting thing to measure! Might explain a lesser adherence to the mask policy in the OV… 🙂
Yes, I’m struggling with ventilation too… it would be a very interesting modality but yes, it seems far fetched. The one thing I think about is if the virus aerosolizes more than we expect (which I’ve seen papers indicating this might be the case) that could explain superspreaders and other weird things.
As per mask wearing… we have an interesting social experiment going on now. We know when lockdown started and ended and now we know when mandatory masks started. If I could find a reasonably populous county (Pinal?) that isn’t mandating masks, then we might learn something. I expect the AZ numbers will be turned over in about a week due to the mask mandates. Already seeing the trend start…